
The thermal use of solar radiation has been done since antiquity by human society once its relatively simple and efficient way of converting solar radiation for various applications, from water heating, dehydration, cooking food, input for industrial processes, and even for generating electricity, more recently.
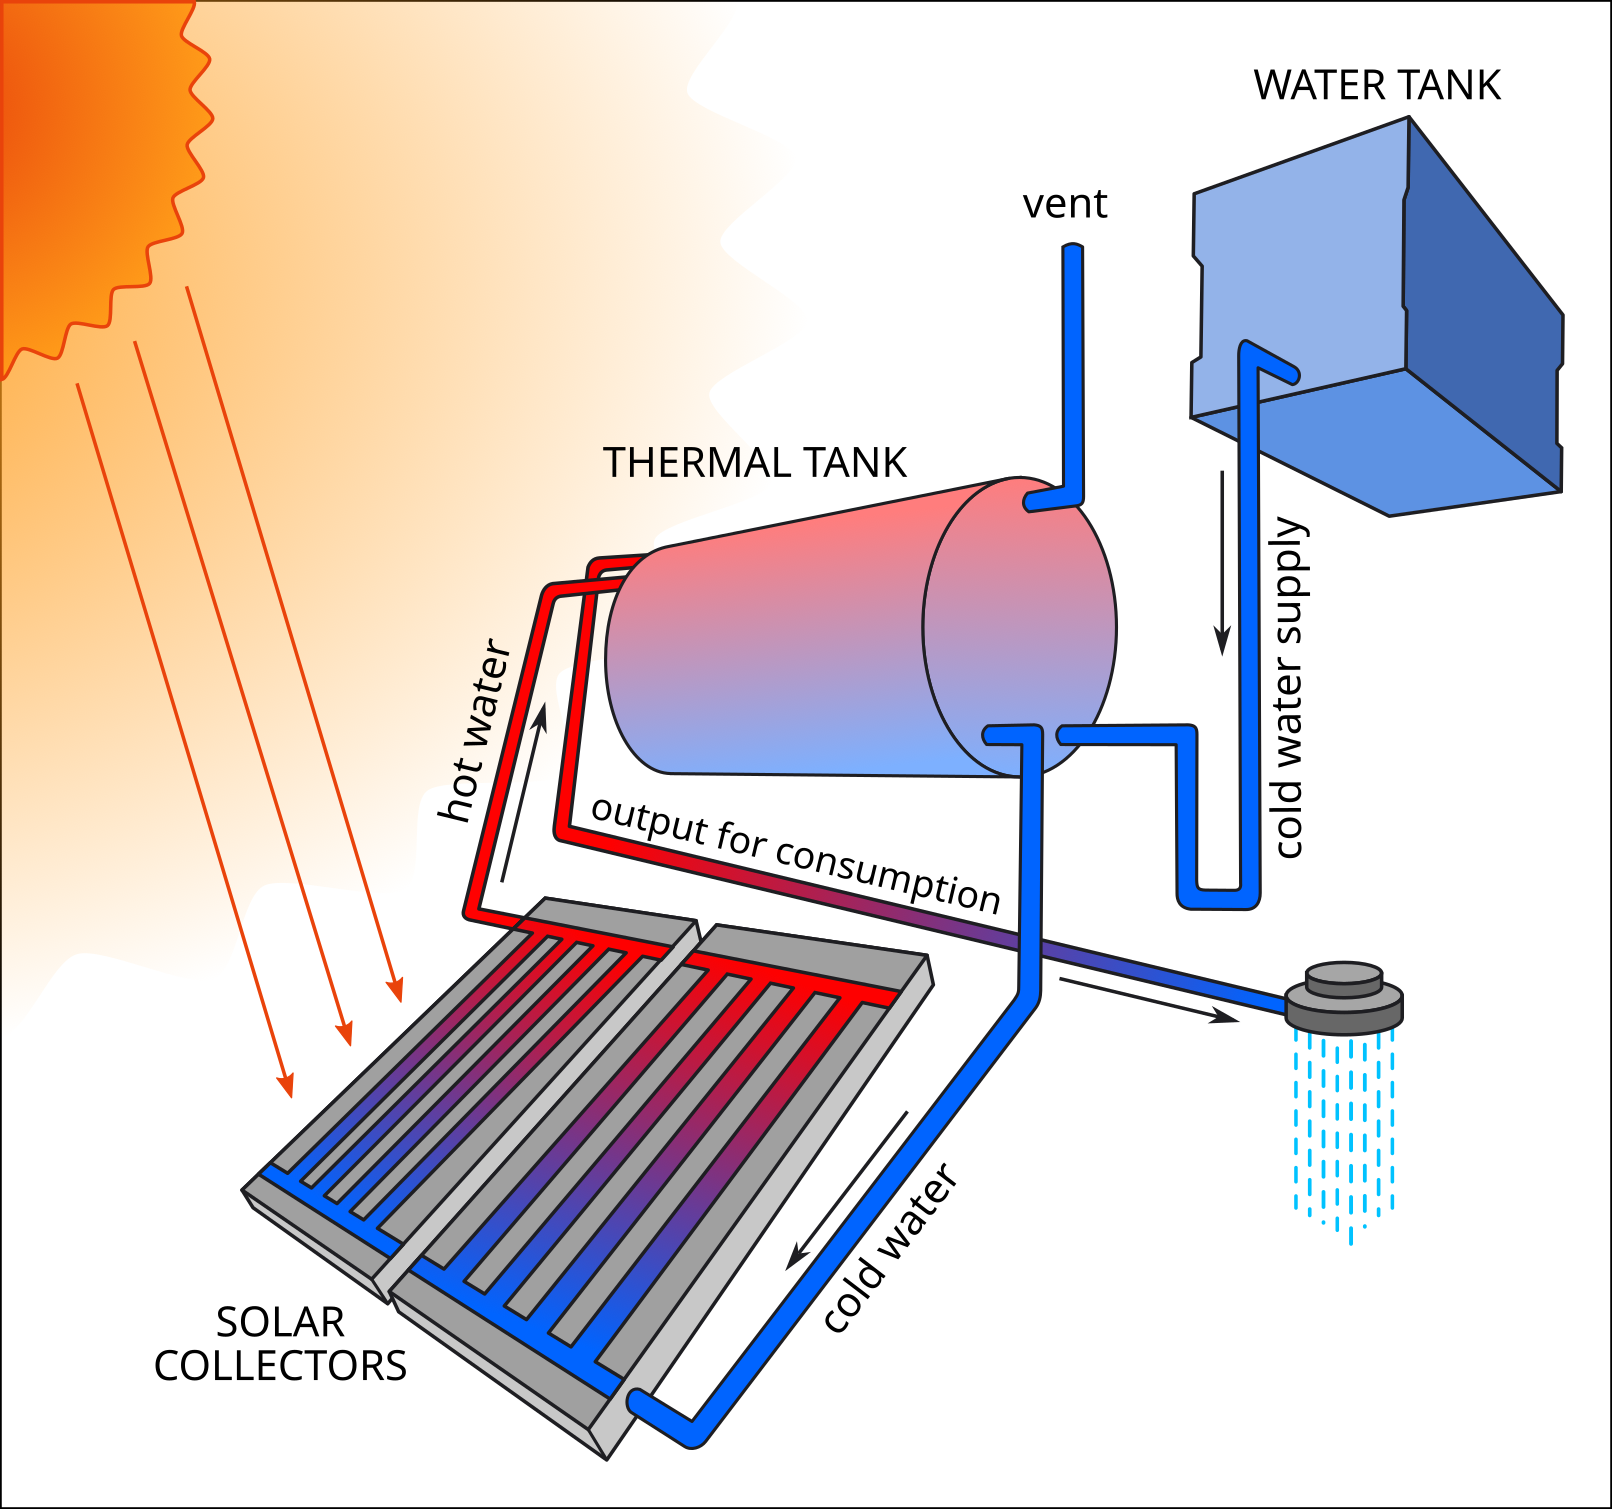
Brazilian commercial, public, and residential buildings are responsible for much of the country's electricity consumption. In particular, the residential electric shower has the greatest impact on domestic electricity consumption. An alternative to reduce domestic electricity consumption is the use of solar water heaters. Figure 6.1 illustrates the operation of a residential solar heater.
Click on the image to enlarge
Figure 6.1. Scheme of a low-cost system for domestic water heating using solar heat.
The climate of the State of Paraíba is not subject to large temperature variations throughout the year compared to the southern and southeastern states. However, it can benefit from using solar thermal energy in industrial processes that require heated water. The textile industry and agro-industries, such as dairy products and fruit processing sheds, are some examples of sectors that could reduce electricity (or firewood) consumption from solar thermal heating for their industrial processes.
Solar thermal energy can also be used to generate electricity. Heliothermal plants or CSP (Concentrated Solar Power) are being proposed and built on an experimental and even commercial basis to provide high energy stability to the grid. This technology consists of mirrors distributed in a spatial arrangement that act as concentrators in a central tower configuration or parabolic troughs/Fresnel mirrors in a linear configuration (Figure 2.10, quoted above, illustrates these systems). In both cases, the heat from solar radiation vaporizes a fluid that moves conventional turbines coupled to generators. Heliothermic solar power plants with central towers still face obstacles to their use in Brazil due to the variability of solar radiation in places with greater insolation associated to the characteristics of the tropical atmosphere. In addition, the high implementation and operation costs make it difficult for this technology to be competitive in the country. On the other hand, hybrid solutions that combine a linear solar concentrator with another complementary heat source (such as biomass) have been gaining attention and may become important alternatives to compose the Brazilian generating complex in the future.
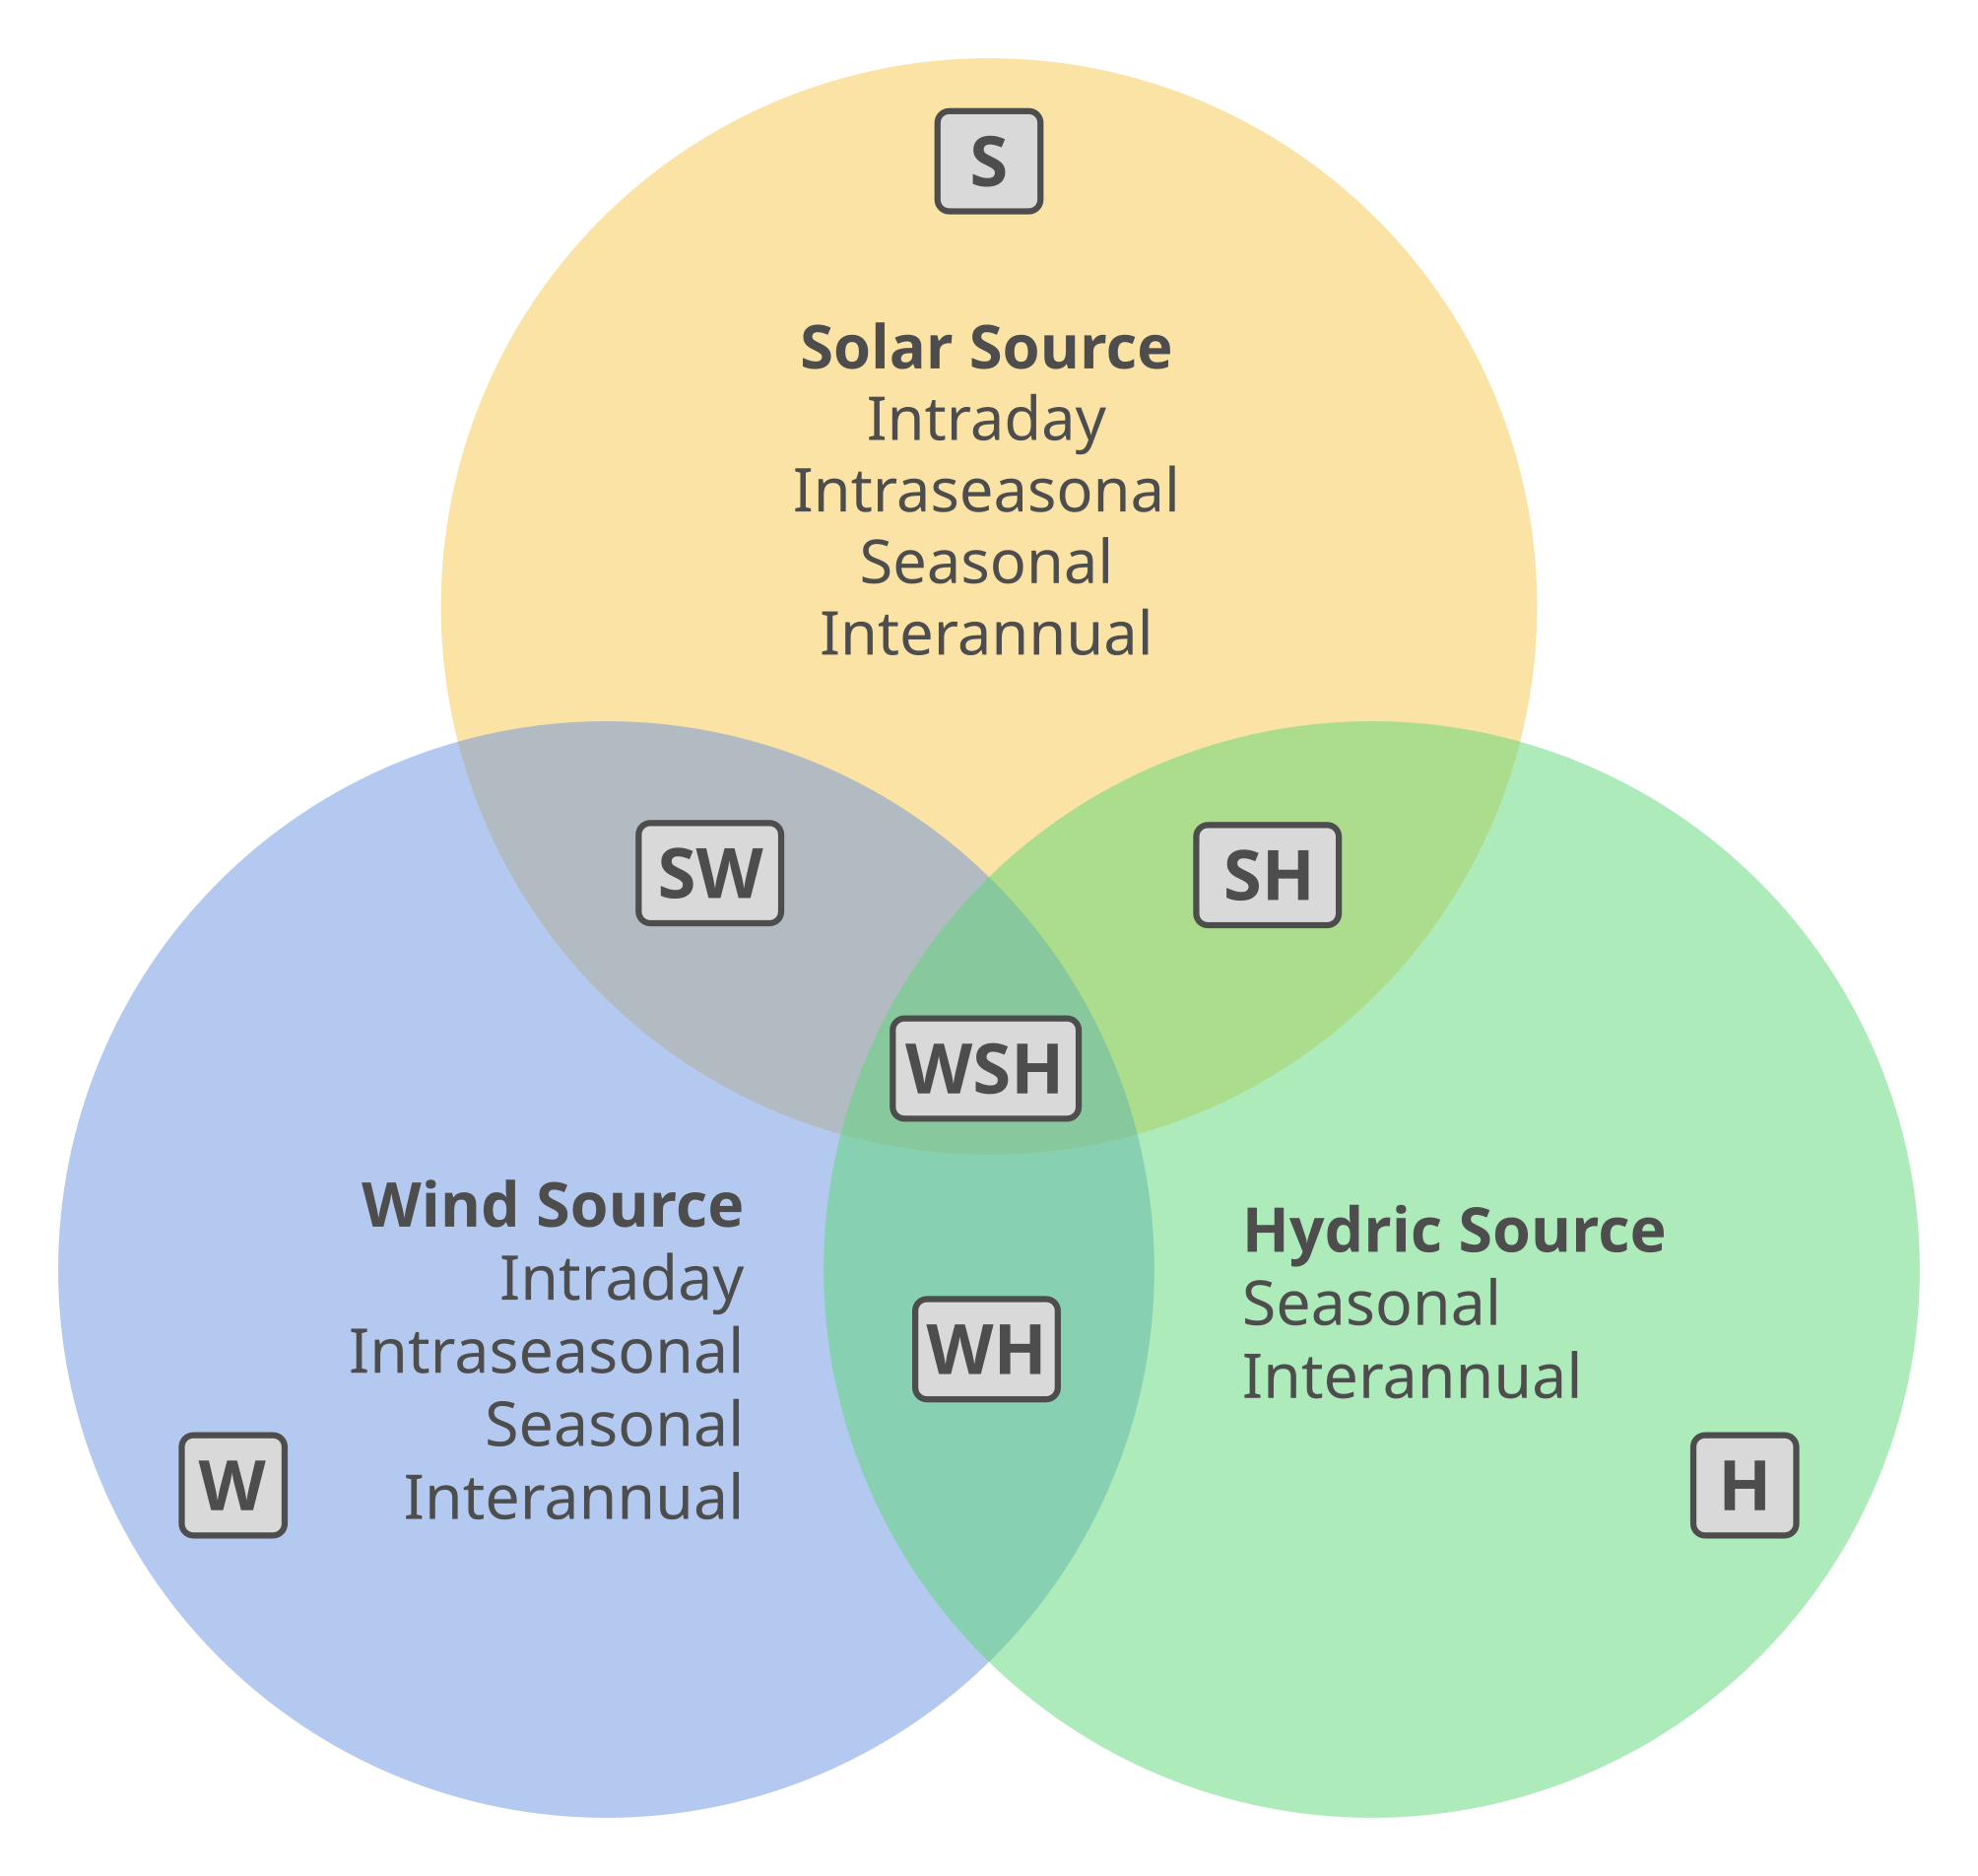
Solar power plants are not dispatchable due to their dependence on fluctuations in weather conditions and consequent variability of incident solar irradiation. Therefore, hybrid solar-wind plants have emerged as an alternative to reduce the variability of the electricity generation park and reduce costs through infrastructure sharing. The states of northeastern Brazil stands out for the abundance of these two energy sources. Furthermore, considering that the SIN is powered mainly by hydroelectric power plants and, therefore, is subject to a strong dependence on the water regime, it can benefit from the growth of energy generated by the solar source. As a rule, dry periods are characterized by less cloudiness and higher solar irradiation levels at the surface. As several studies have already shown, periods of more intense winds (trade winds) are also characterized by less precipitation in the northeast region. Thus, the complementarity between hydro-solar-wind sources (Figure 6.2) is an important opportunity to maximize the use of renewable energies with safety and low environmental impact.
Click on the image to enlarge
Figure 6.2 - Diagram explaining possible complementarities between renewable sources and respective scales of variability.
Source: André Gonçalves, 2017.
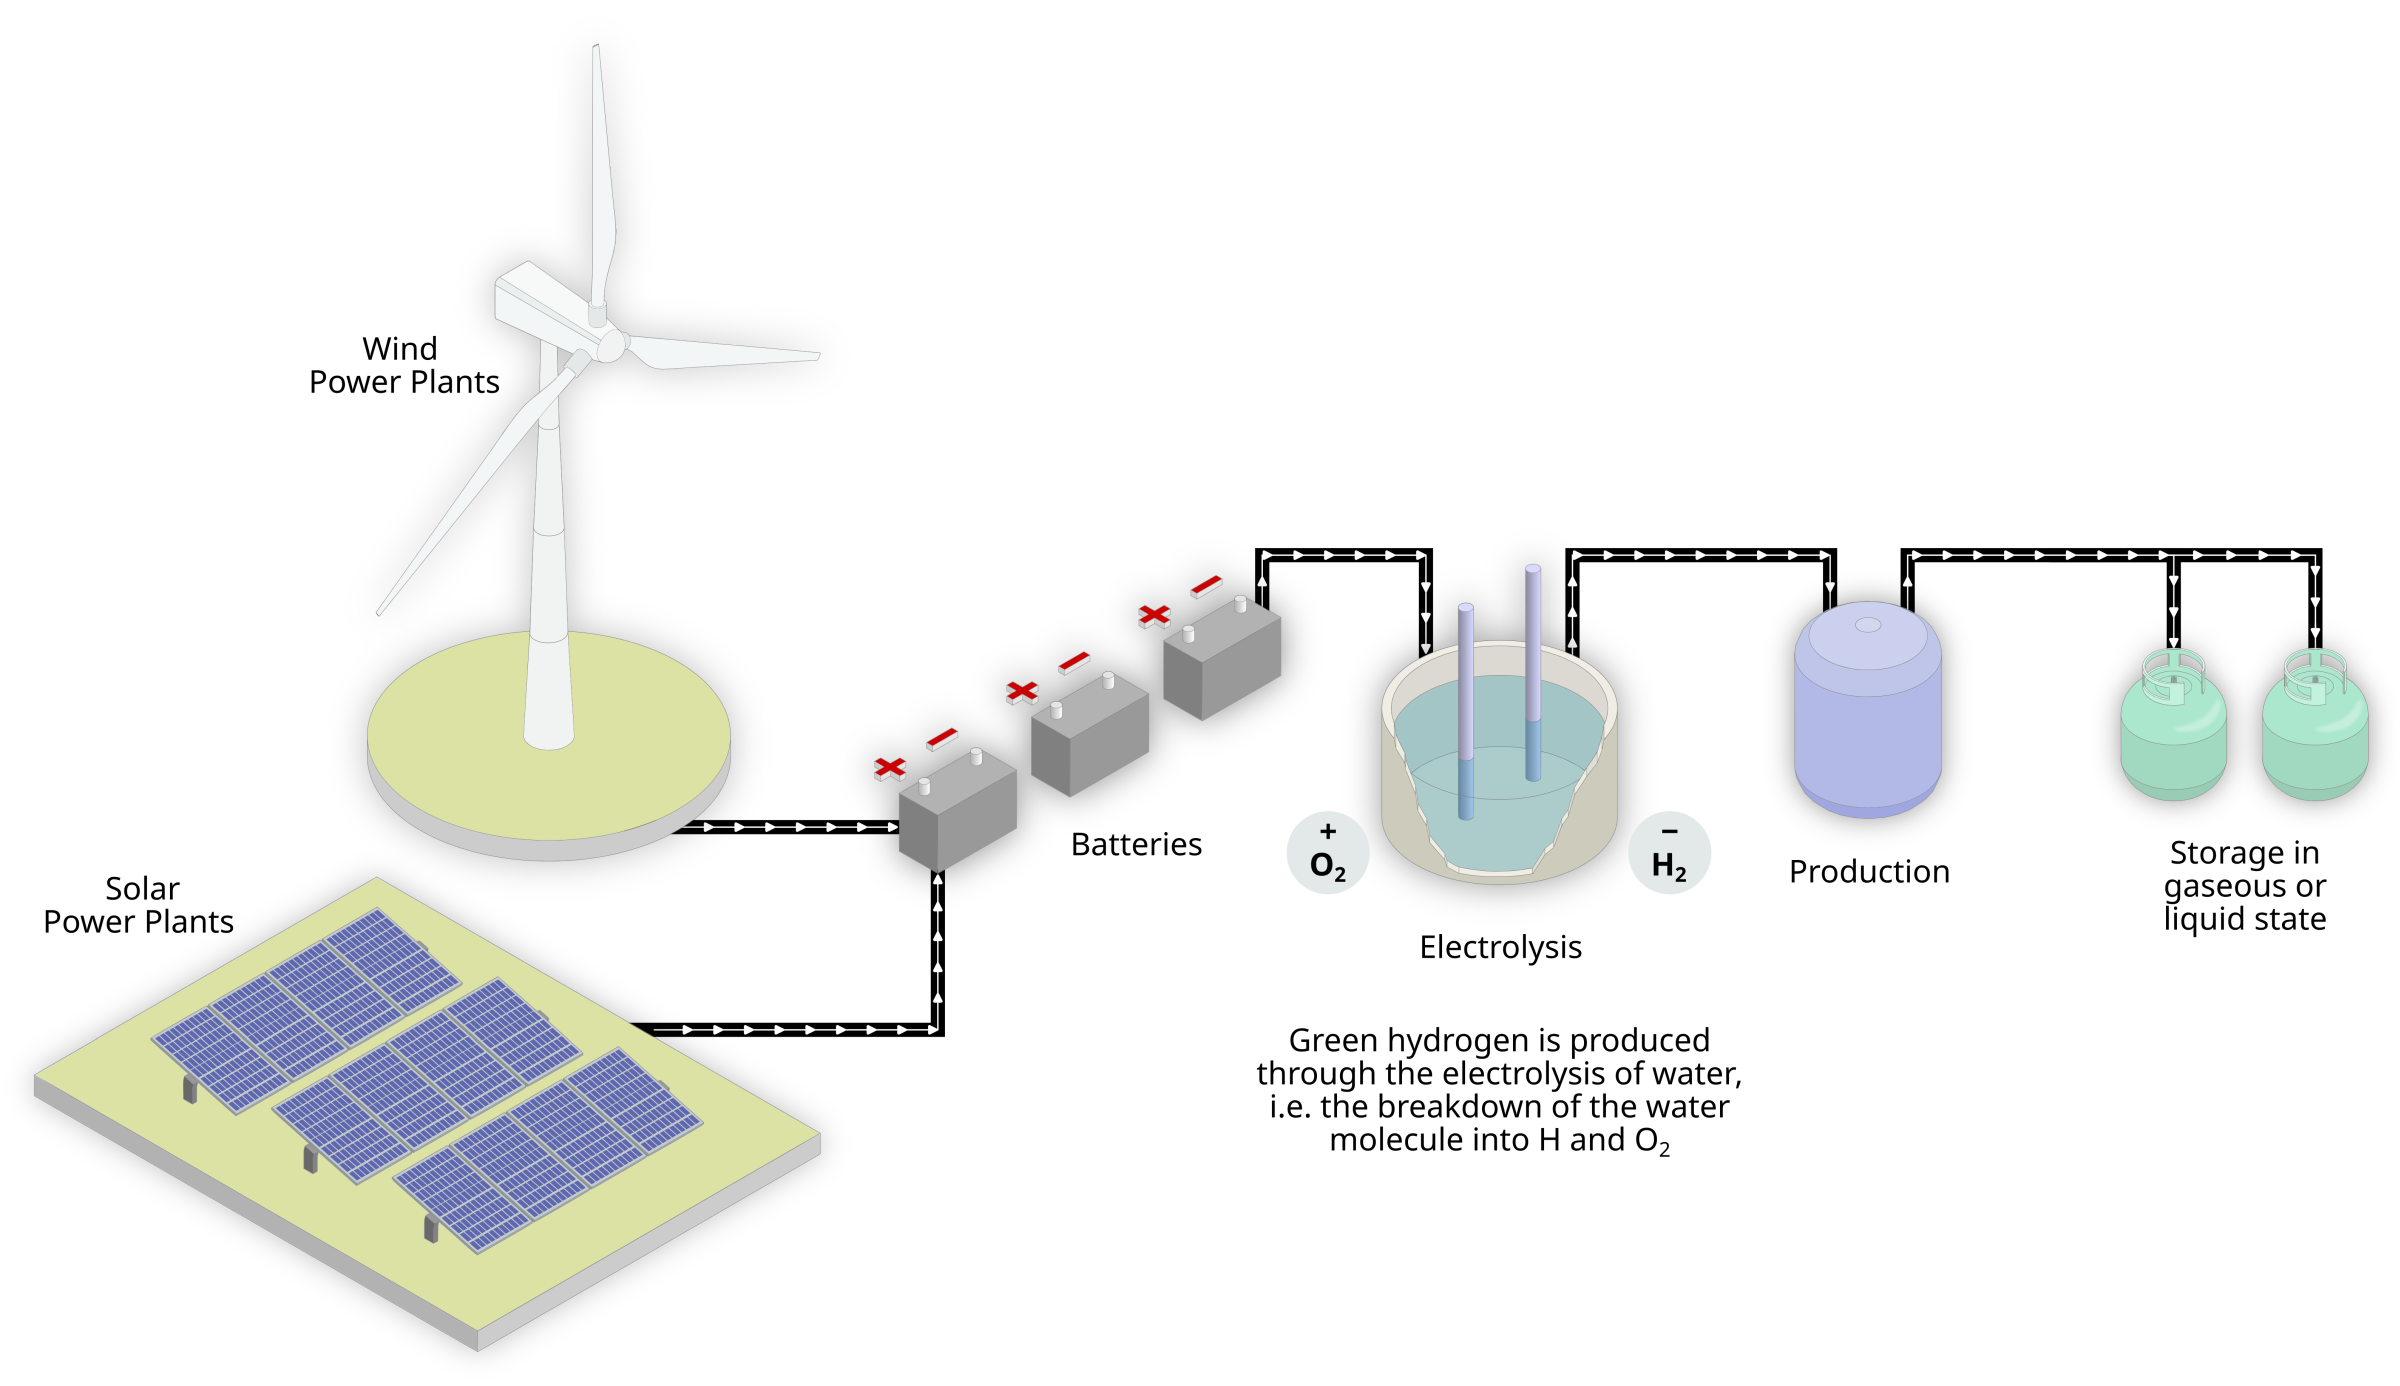
The hydrogen production from renewable energy sources, known as green hydrogen, emerges as a new energy vector for decarbonizing energy matrices worldwide. In addition to the already traditional markets, such as the ammonia and fertilizer manufacturing industry, In the refining process and other uses, new markets for green hydrogen can be developed in the segments of transport, electricity generation, energy storage, and several industrial processes. Climate neutrality and energy security goals have led solid economies in countries in Europe and Asia to launch significant investments to promote a clean energy transition based on green hydrogen. However, many of these countries have less potential for renewable energy than Brazil, disfavoring its local production and opening up a promising market for the export of this commodity by Brazil. Remarkably, the northeastern Brazilian states have high levels of solar irradiation throughout the year, with very low interannual and decadal variability, and such conditions could be ideal for the development of green hydrogen production plants. However, producing green hydrogen through the electrolysis of water requires more than 18 liters of fresh water to produce one kilogram of hydrogen, considering the current state of technology. This represents a challenge for Brazilian states where water resources are scarcer, strictly where the highest levels of solar irradiation occur. Figure 6.3 presents the green hydrogen production scheme.
Click on the image to enlarge
Figure 6.3 - Production process of green hydrogen, using the electrical energy from solar and wind renewable sources.
Solar energy generation plays an essential role in the paradigm of modern, sustainable economic growth with low environmental impact. As an emission-free source during electricity generation, solar energy can reduce CO₂ emissions from the electricity generation sector, since each MWh of energy generated using the solar source avoids between 534 and 1143 kg of CO₂ equivalent emitted to the atmosphere in thermoelectric plants fed with fossil fuels.
The diversification and electrification of the Brazilian energy matrix represent an environmental and economic opportunity if carried out on predominantly renewable bases. In this context, solar energy stands out among low-carbon technologies in at least three key aspects:
The rapid evolution of storage systems, with batteries, thermal storage, or the future use of green hydrogen, adds to the gains promoted by solar energy. It will allow boosting the decarbonization of more difficult sectors, such as transport and cement and steel industries. Therefore, solar energy represents one of the main alternatives for the country's strategic positioning in the green hydrogen market, which can make Brazil one of the most competitive countries in the world in the long term.
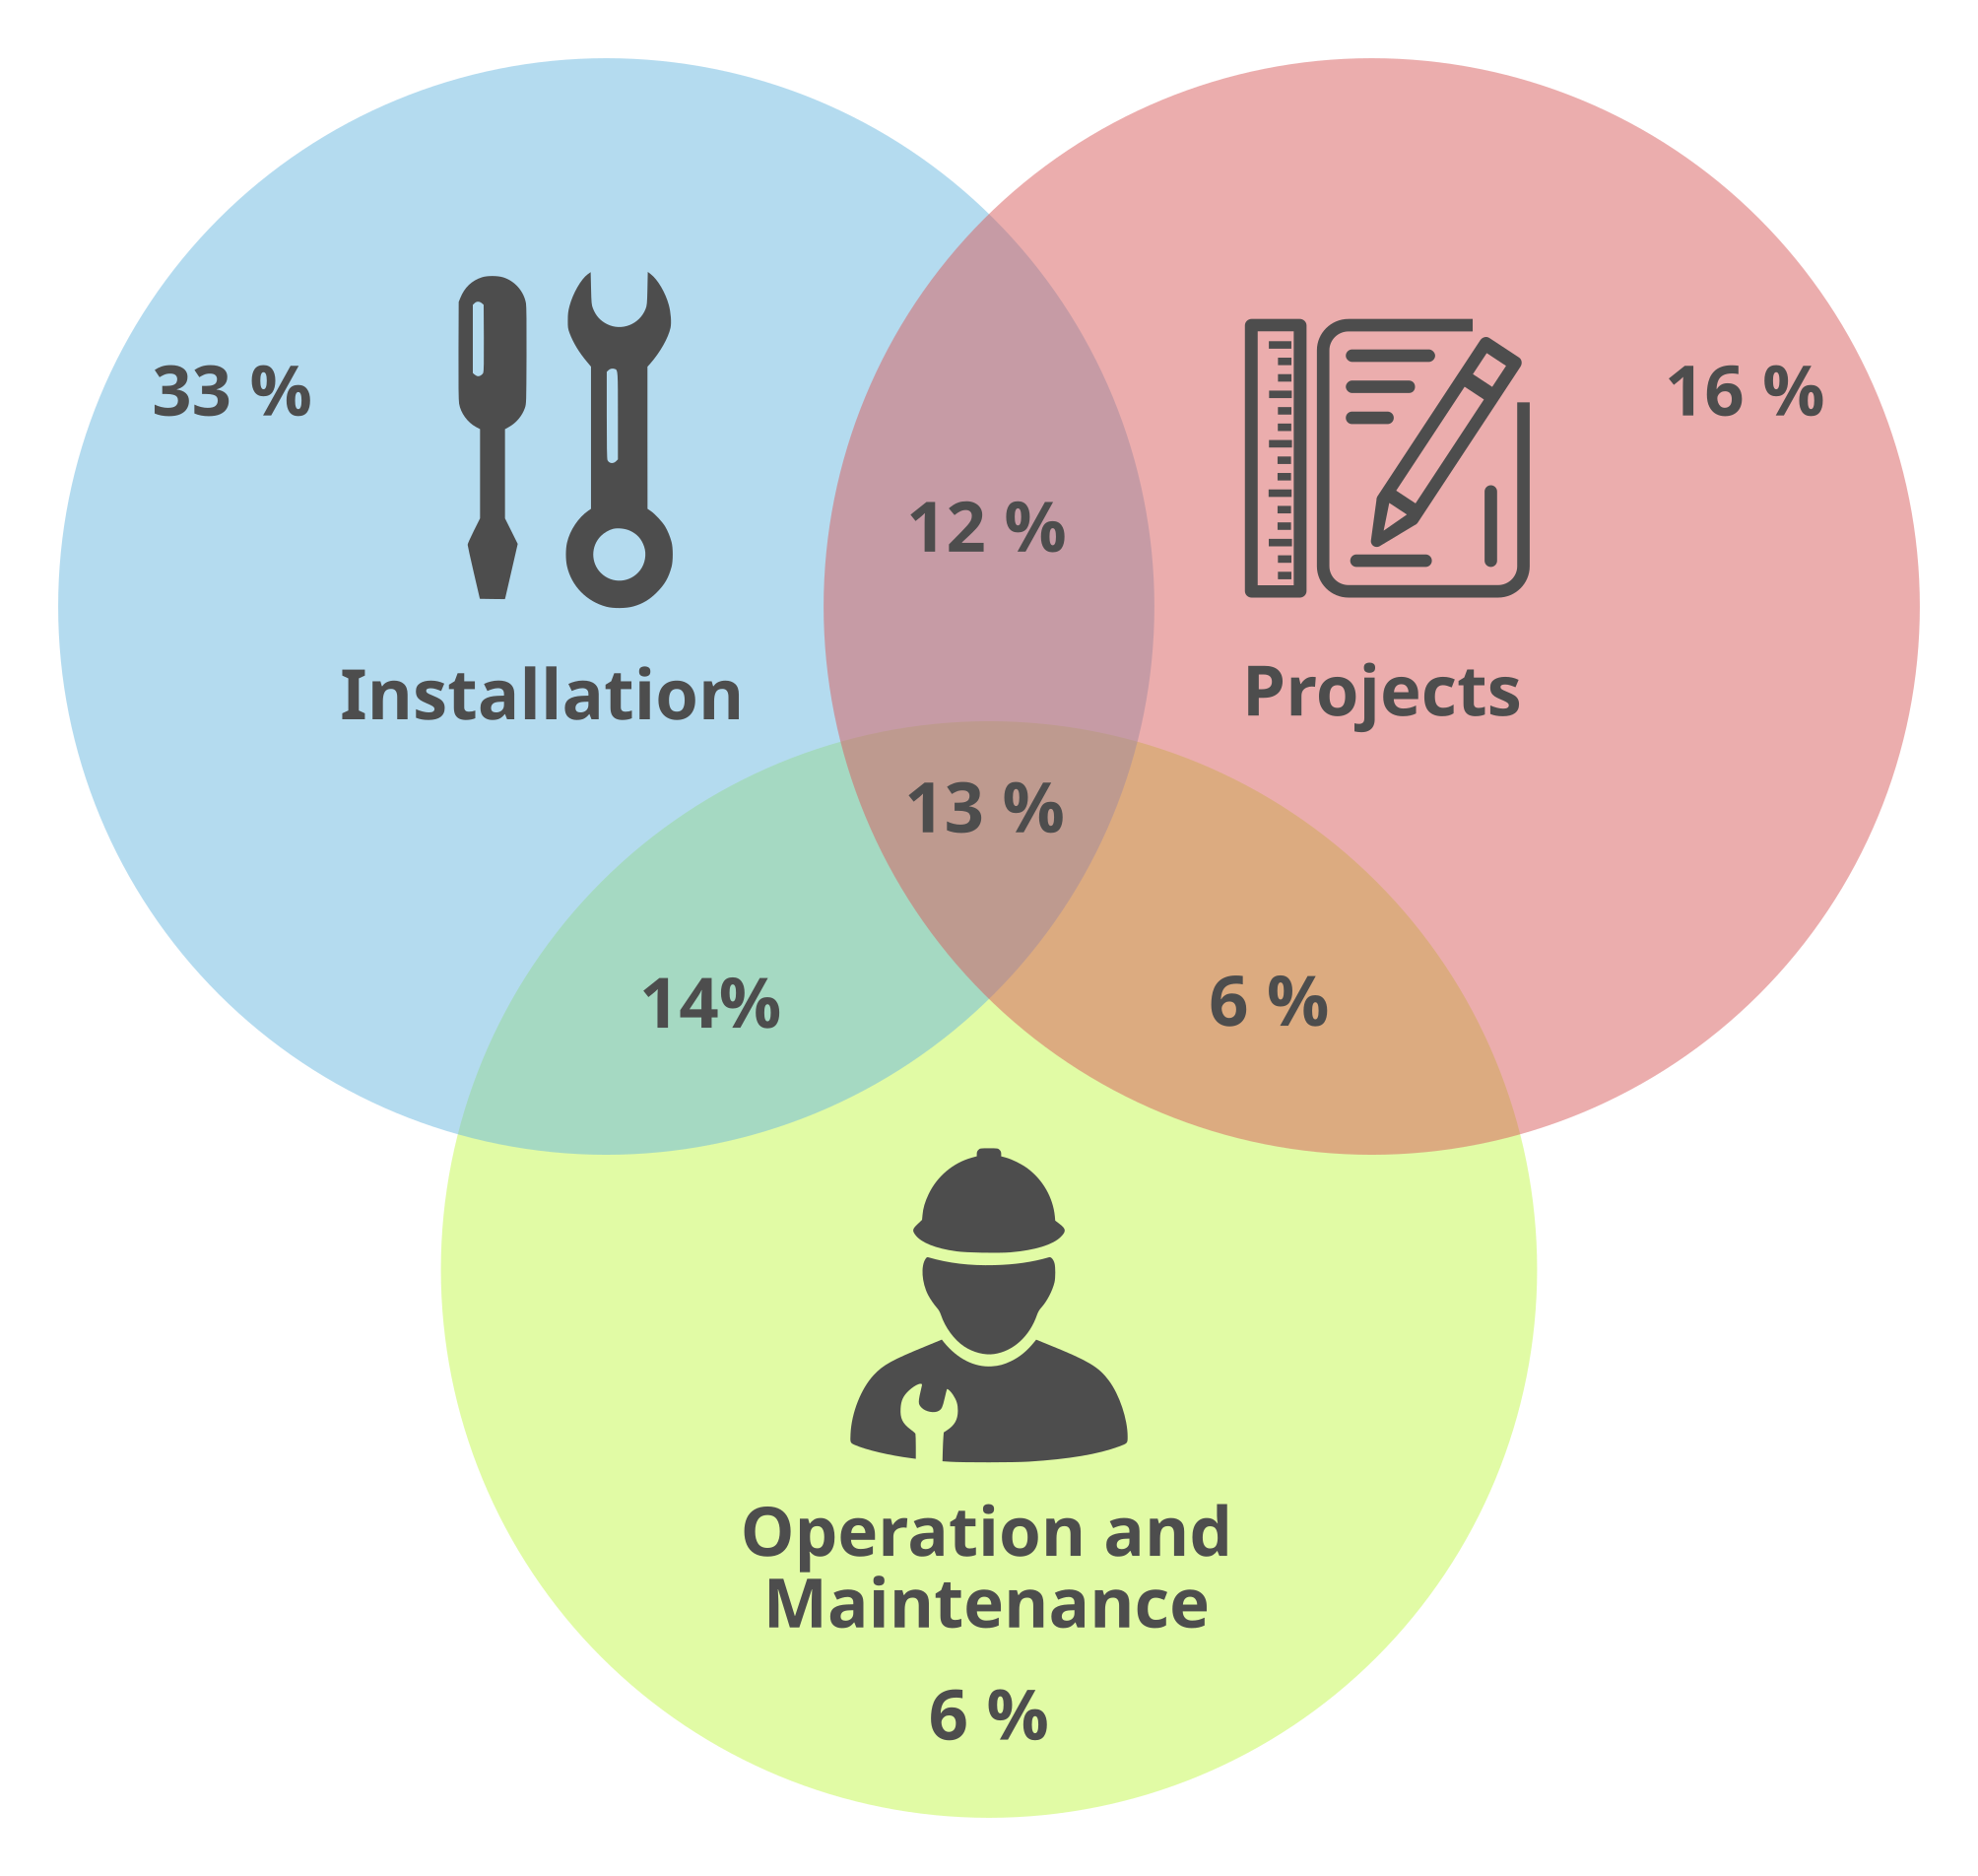
According to data from the Associação Brasileira de Energia Solar Fotovoltaica (ABSOLAR), the use of technologies for harnessing solar energy has already generated more than 390,000 jobs between 2012 and 2020, with the largest share coming from the distributed generation segment, due to the substantial expansion of this sector. The generation of direct jobs occurs mainly in the installation of photovoltaic systems and it has a positive impact on advancing secondary vocational education, as illustrated in Figure 6.4. Indirect jobs are associated with the steel, aluminum, copper, and concrete chain due to the materials used in the facilities.
Click on the image to enlarge
Figure 6.4 - Performance profile of direct jobs the solar energy sector generates.
Source: ABSOLAR.
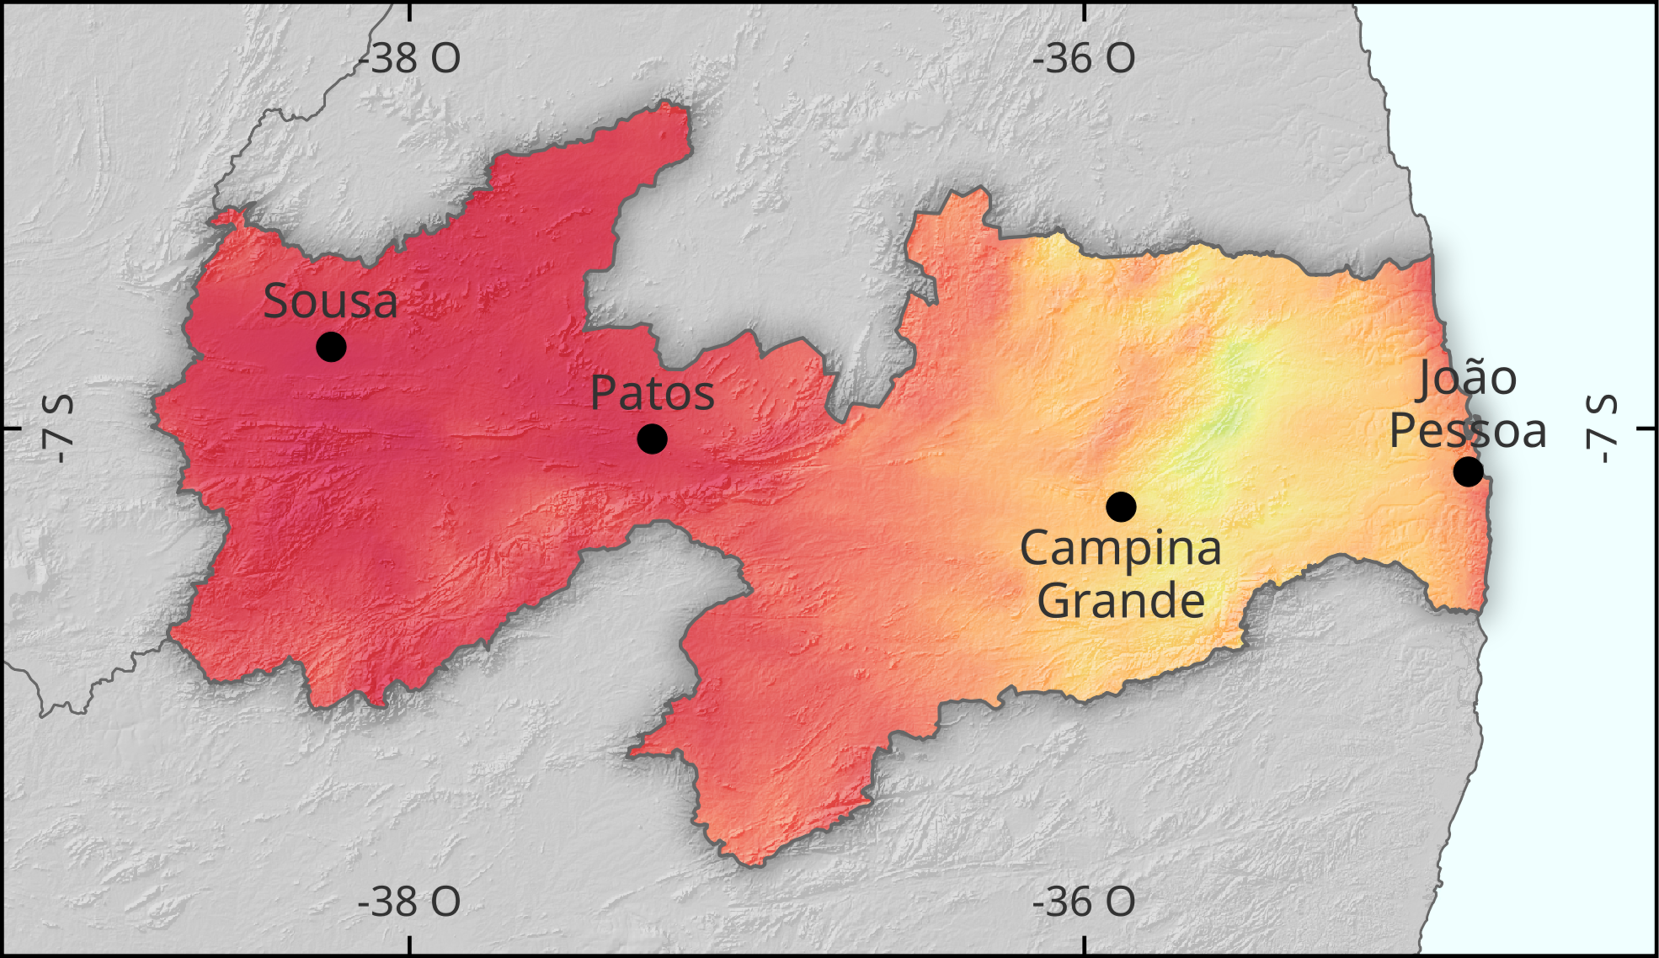
Four important representative cities of the State of Paraíba were selected to study climate variability, as shown in Figure 6.5.
Click on the image to enlarge
Figure 6.5 - Representative locations for generating variability graphs: João Pessoa, Campina Grande, Patos, and Sousa.
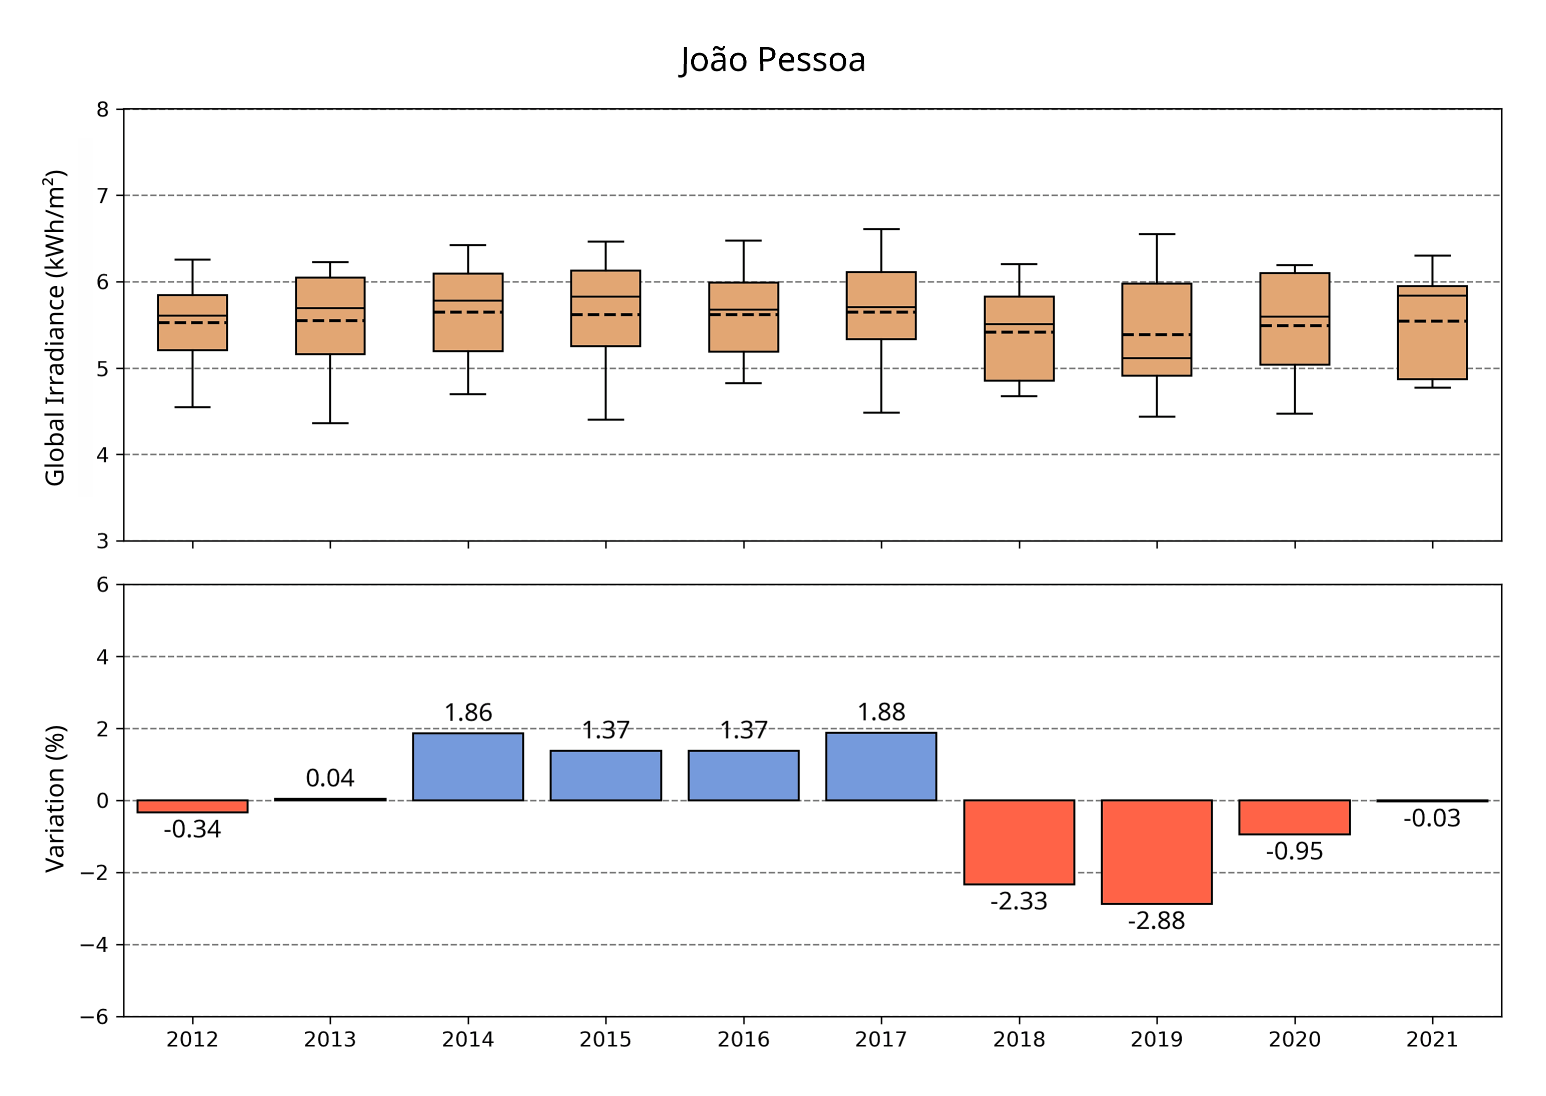
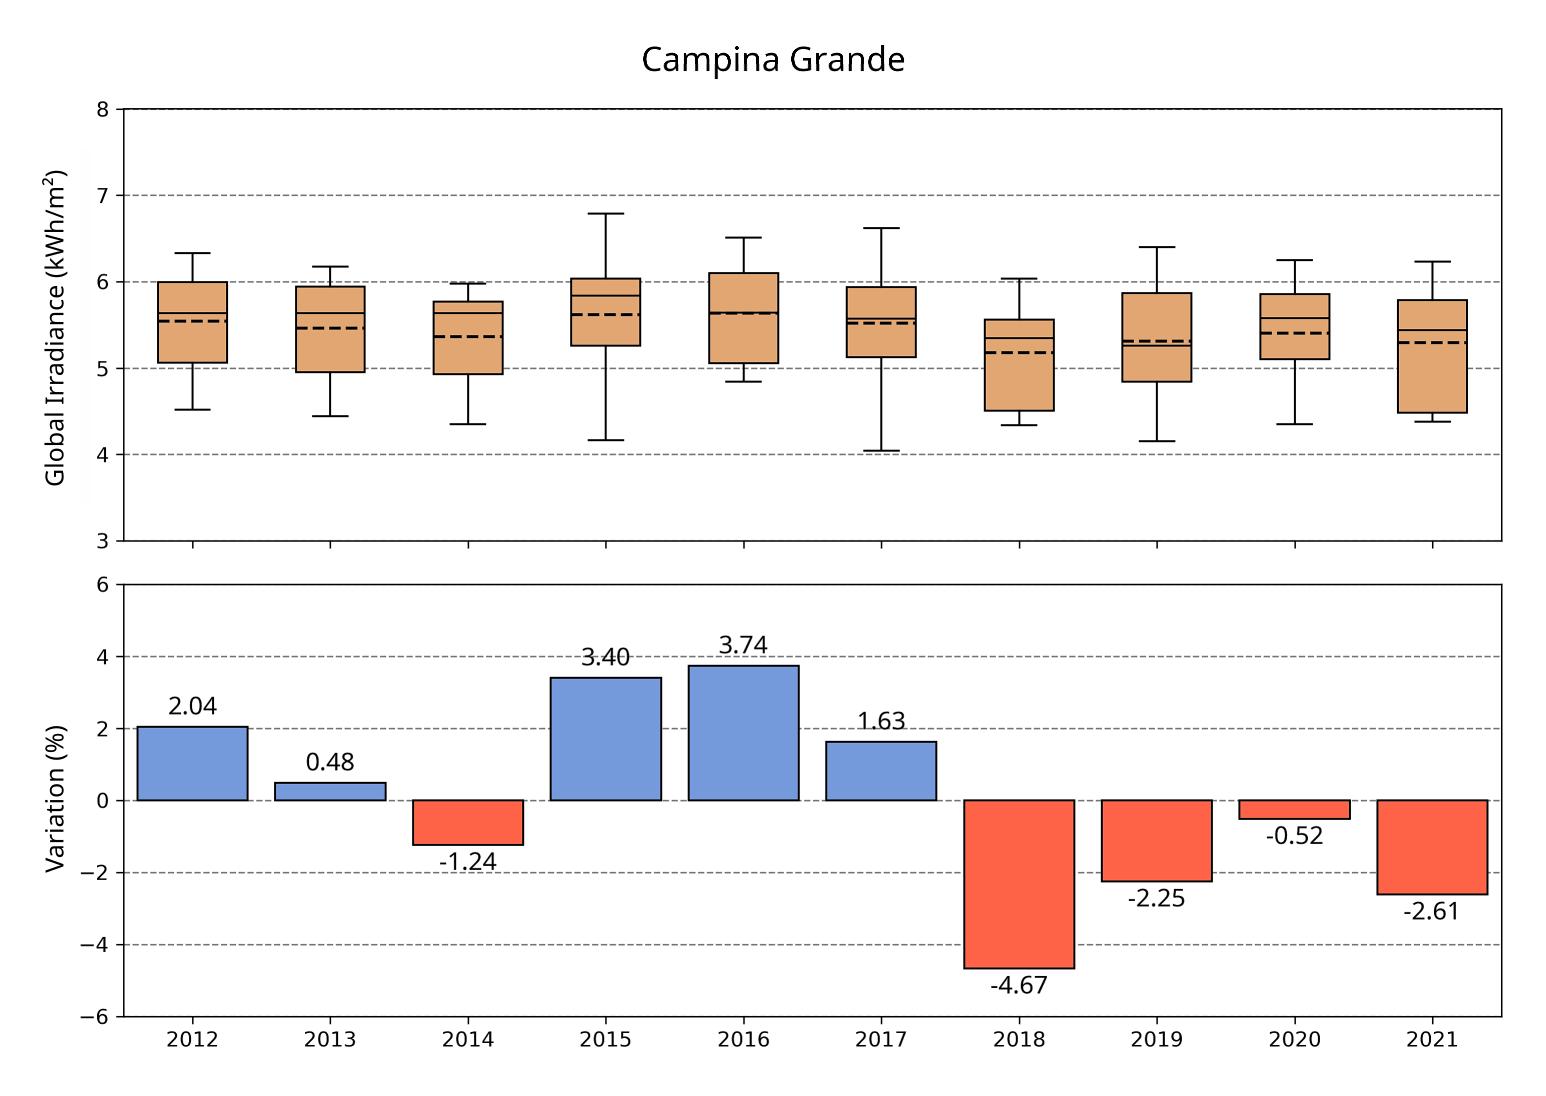
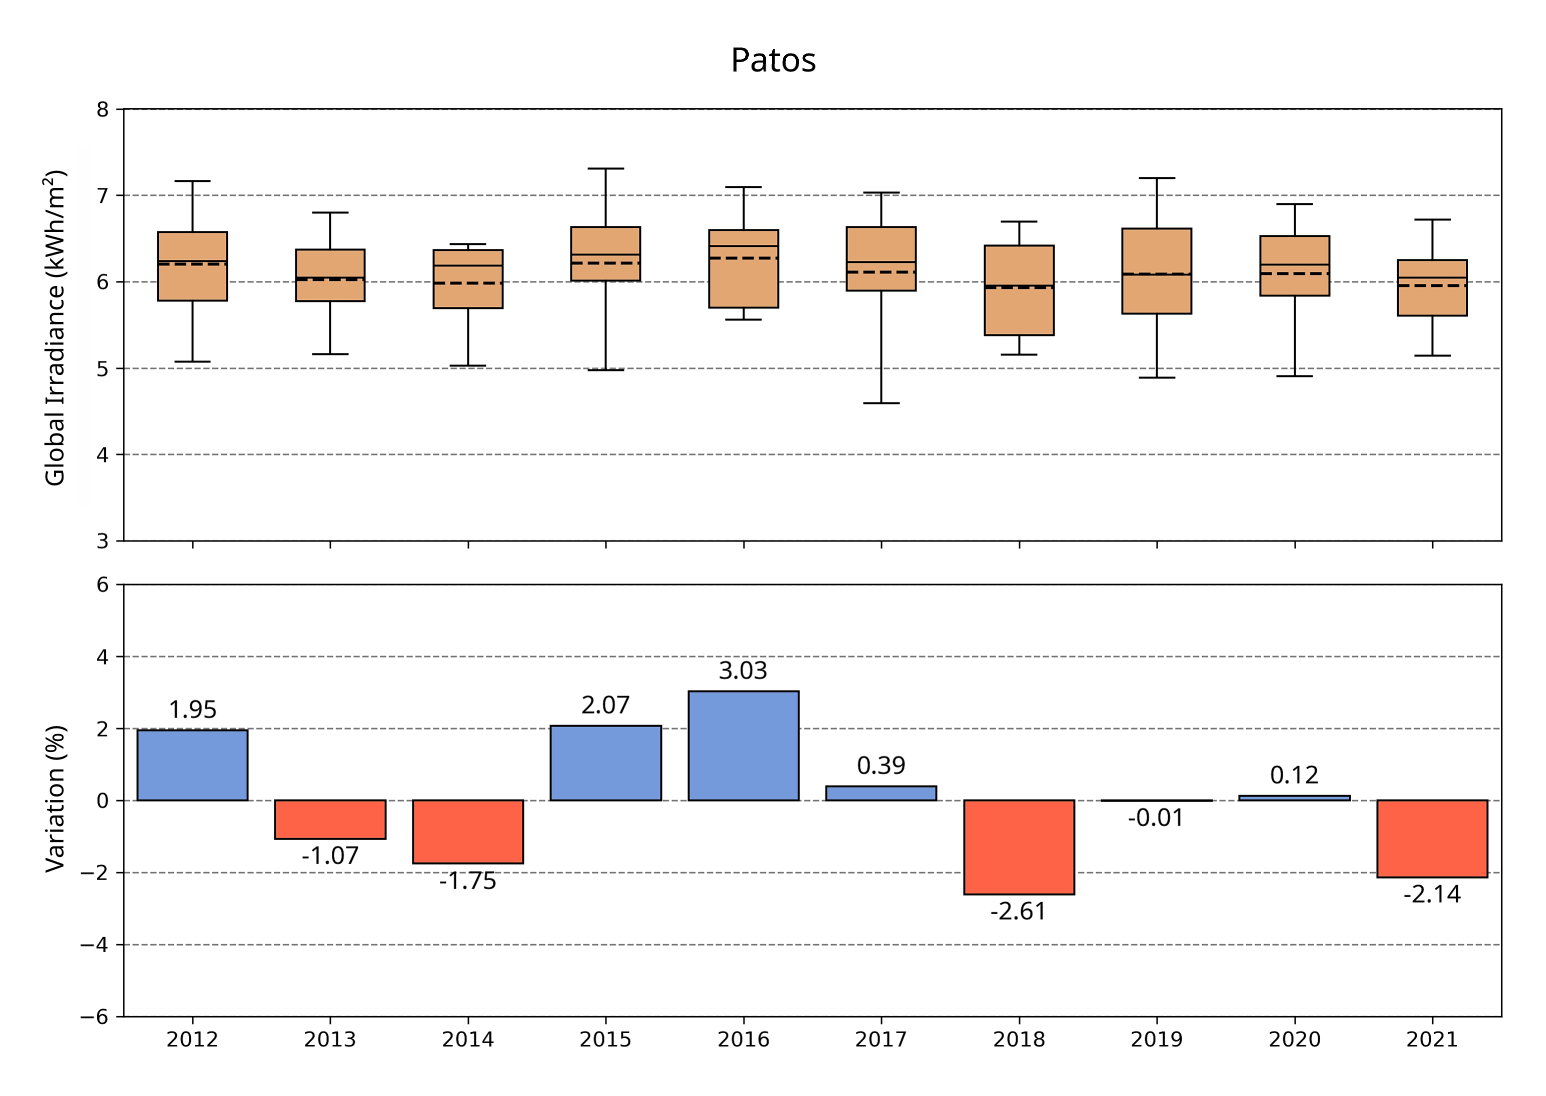
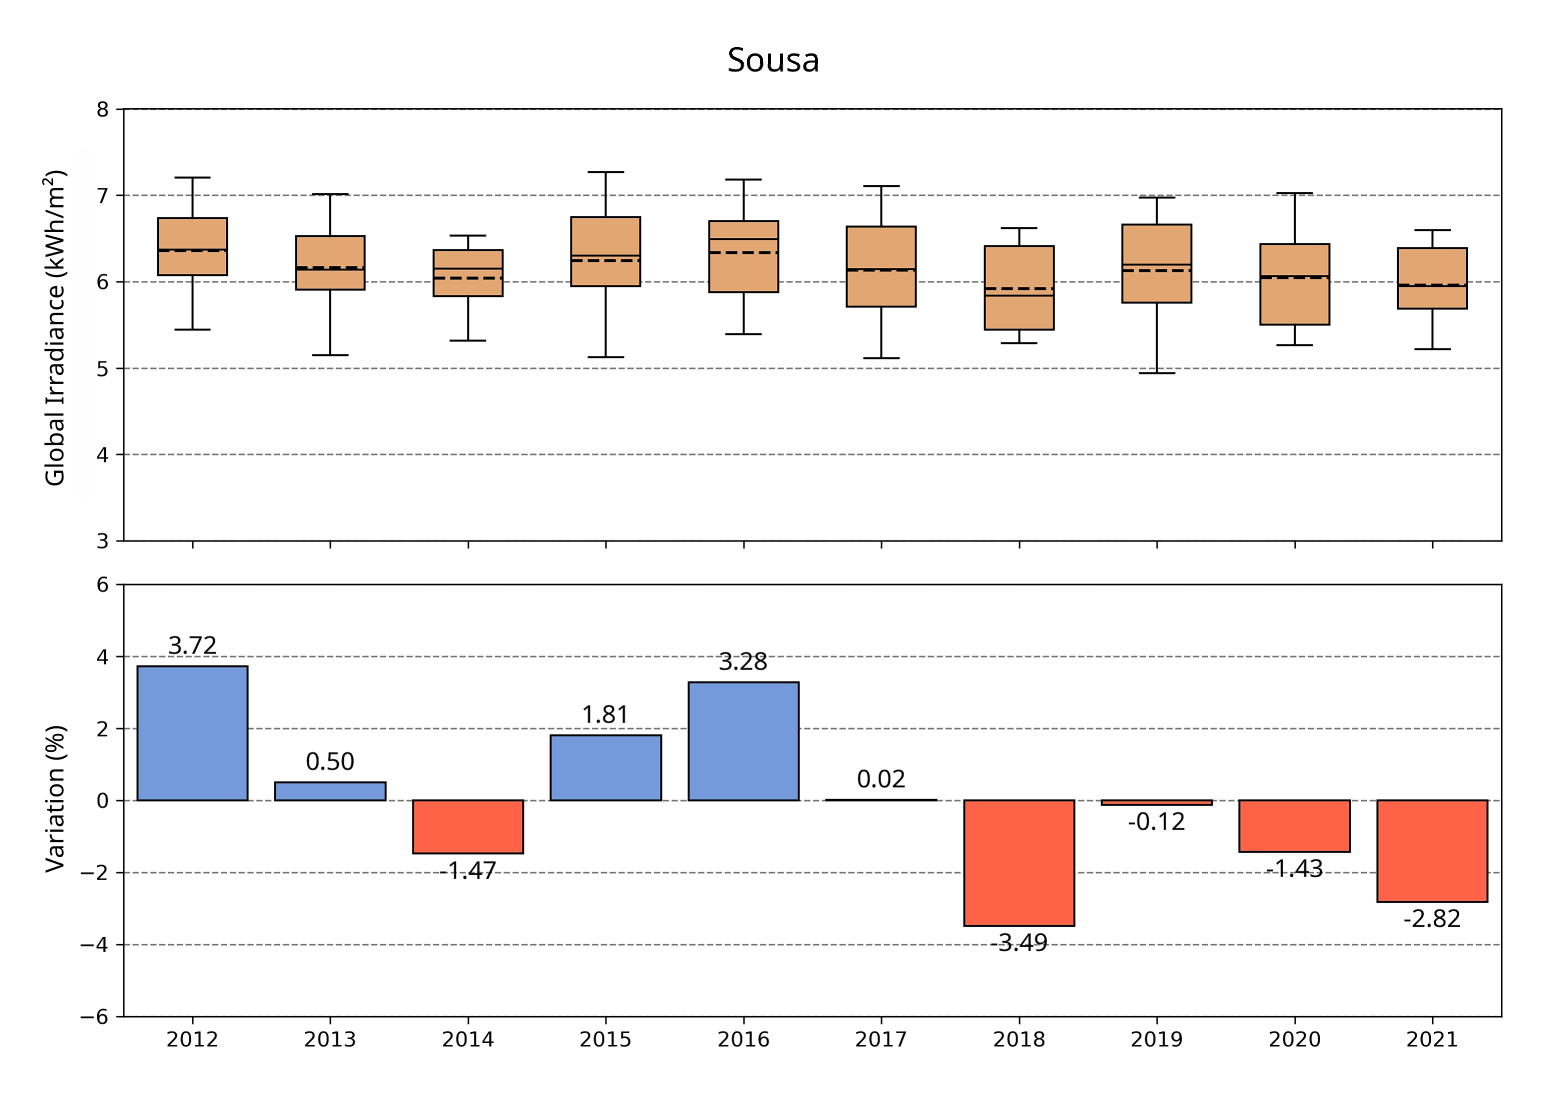
The solar resource has high daily variability due to the diurnal cycle and moderate intraseasonal variability. In the State of Paraíba, where the annual average of global irradiation is 5.71 kWh/m², daily totals of solar irradiation can vary from 2.0 kWh/m² to 8.0 kWh/m², daily totals can vary from 2.0 kWh/m² to 8.0 kWh/m², depending on the variability of weather systems. However, the solar resource has low variability over the years for the State of Paraíba. Hence, the variation between a year of high and another year with low solar radiation is typically less than 5.0% of the mean climatological value, as shown in Figure 6.6. This variability is lower than the seasonal variability shown by the extremes of the box plots. These data demonstrate the higher interannual stability of solar generation compared to other renewable sources available in the region, such as wind power and hydroelectricity. As for trends, future climate scenarios indicate a slight reduction (from 1% to 2%) in the solar potential in the mesoregions of Sertão Paraibano, Borborema, and Agreste Paraibano until the middle of the century, although there is still significant uncertainty about these impacts.
Click on the image to enlarge
Figure 6.6 - Graphs of the climatic variability of the solar resource in four representative locations: João Pessoa, Campina Grande, Patos and Sousa. The box plot (top) shows seasonal variability through the distribution of monthly averages throughout the year. The annual average is shown as a dashed line. The variation graph (bottom) shows the variation of the annual averages around the long-term (climatological) average.
Observing the variation of solar irradiation in the four locations, it is clear that the solar energy resource showed a positive variation in the years 2015 and 2016 in all locations. On the other hand, the solar energy resource presented values below the average in the four locations in 2018, with a reduction of up to 3.5% concerning the average of the 10 years.
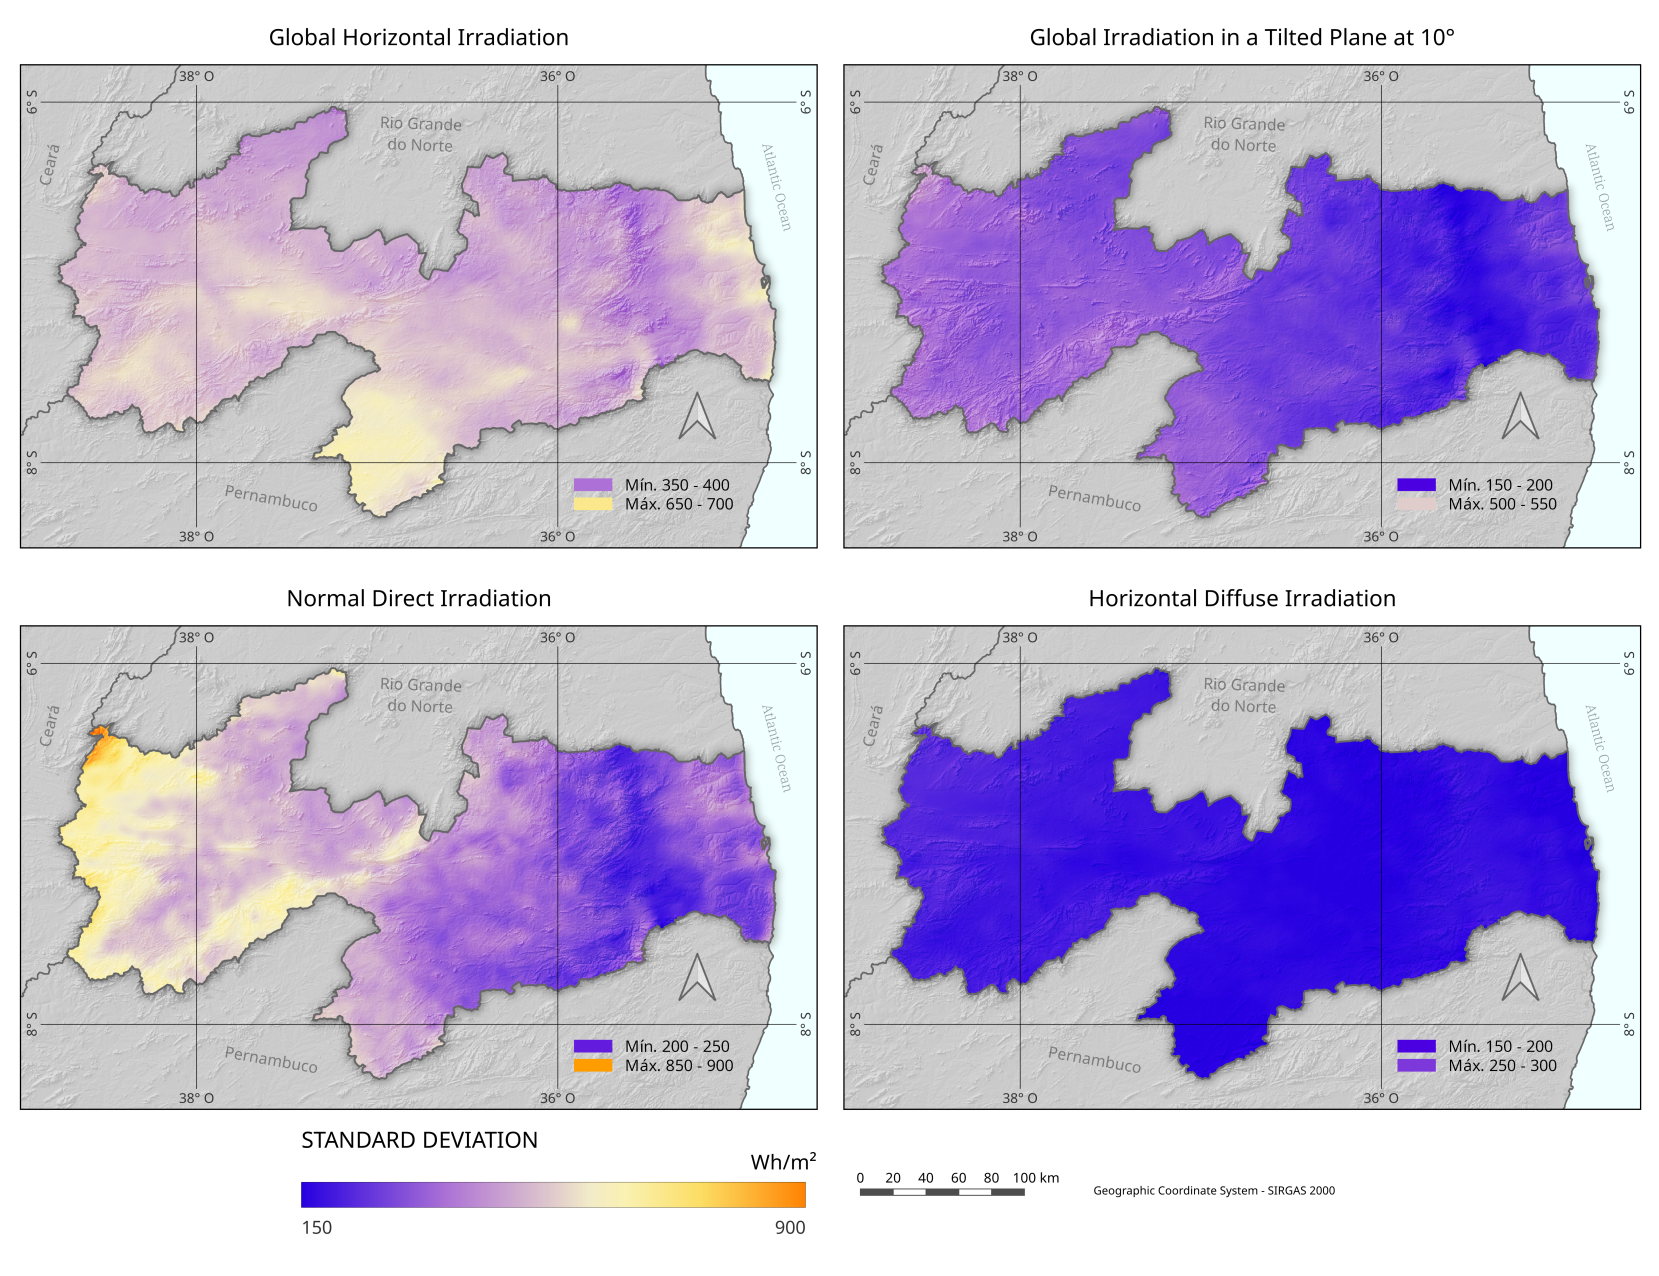
Figure 6.7 shows the daily variability for each component of solar irradiation in Paraíba, estimated by the standard deviation (σ) of total daily irradiation over the years. In principle, the standard deviation can be helpful in estimating how different the days are around the mean (μ), so that μ +/- σ contains 68.2% of the days, μ +/- 2σ contains 95,6% of days, and so on, assuming approximately Gaussian distributions.
Click on the image to enlarge
Figure 6.7 - Standard deviation (σ) of total daily irradiation (a) global horizontal; (b) global slope; (c) normal direct and (d) horizontal diffuse obtained over the years 2012 to 2021.
It can be seen from the maps that the highest GHI variability (over 600 Wh/m²) occurs in the southwest portion of the intermediate region of Campina Grande (near the municipality of Monteiro) and also in small portions of the intermediate regions of João Pessoa (near to the coast) and Patos. On the other hand, the DNI shows greater variability northwest of the intermediate region of Souza-Cajazeiras, reaching values above 800 Wh/m². The global irradiation on the inclined plane (GTI) presents a variability 20% lower than the GHI, reaching maximum values in the range of 500 Wh/m². DHI shows low variability throughout the state, with absolute values in the 150 – 300 Wh/m² range.