
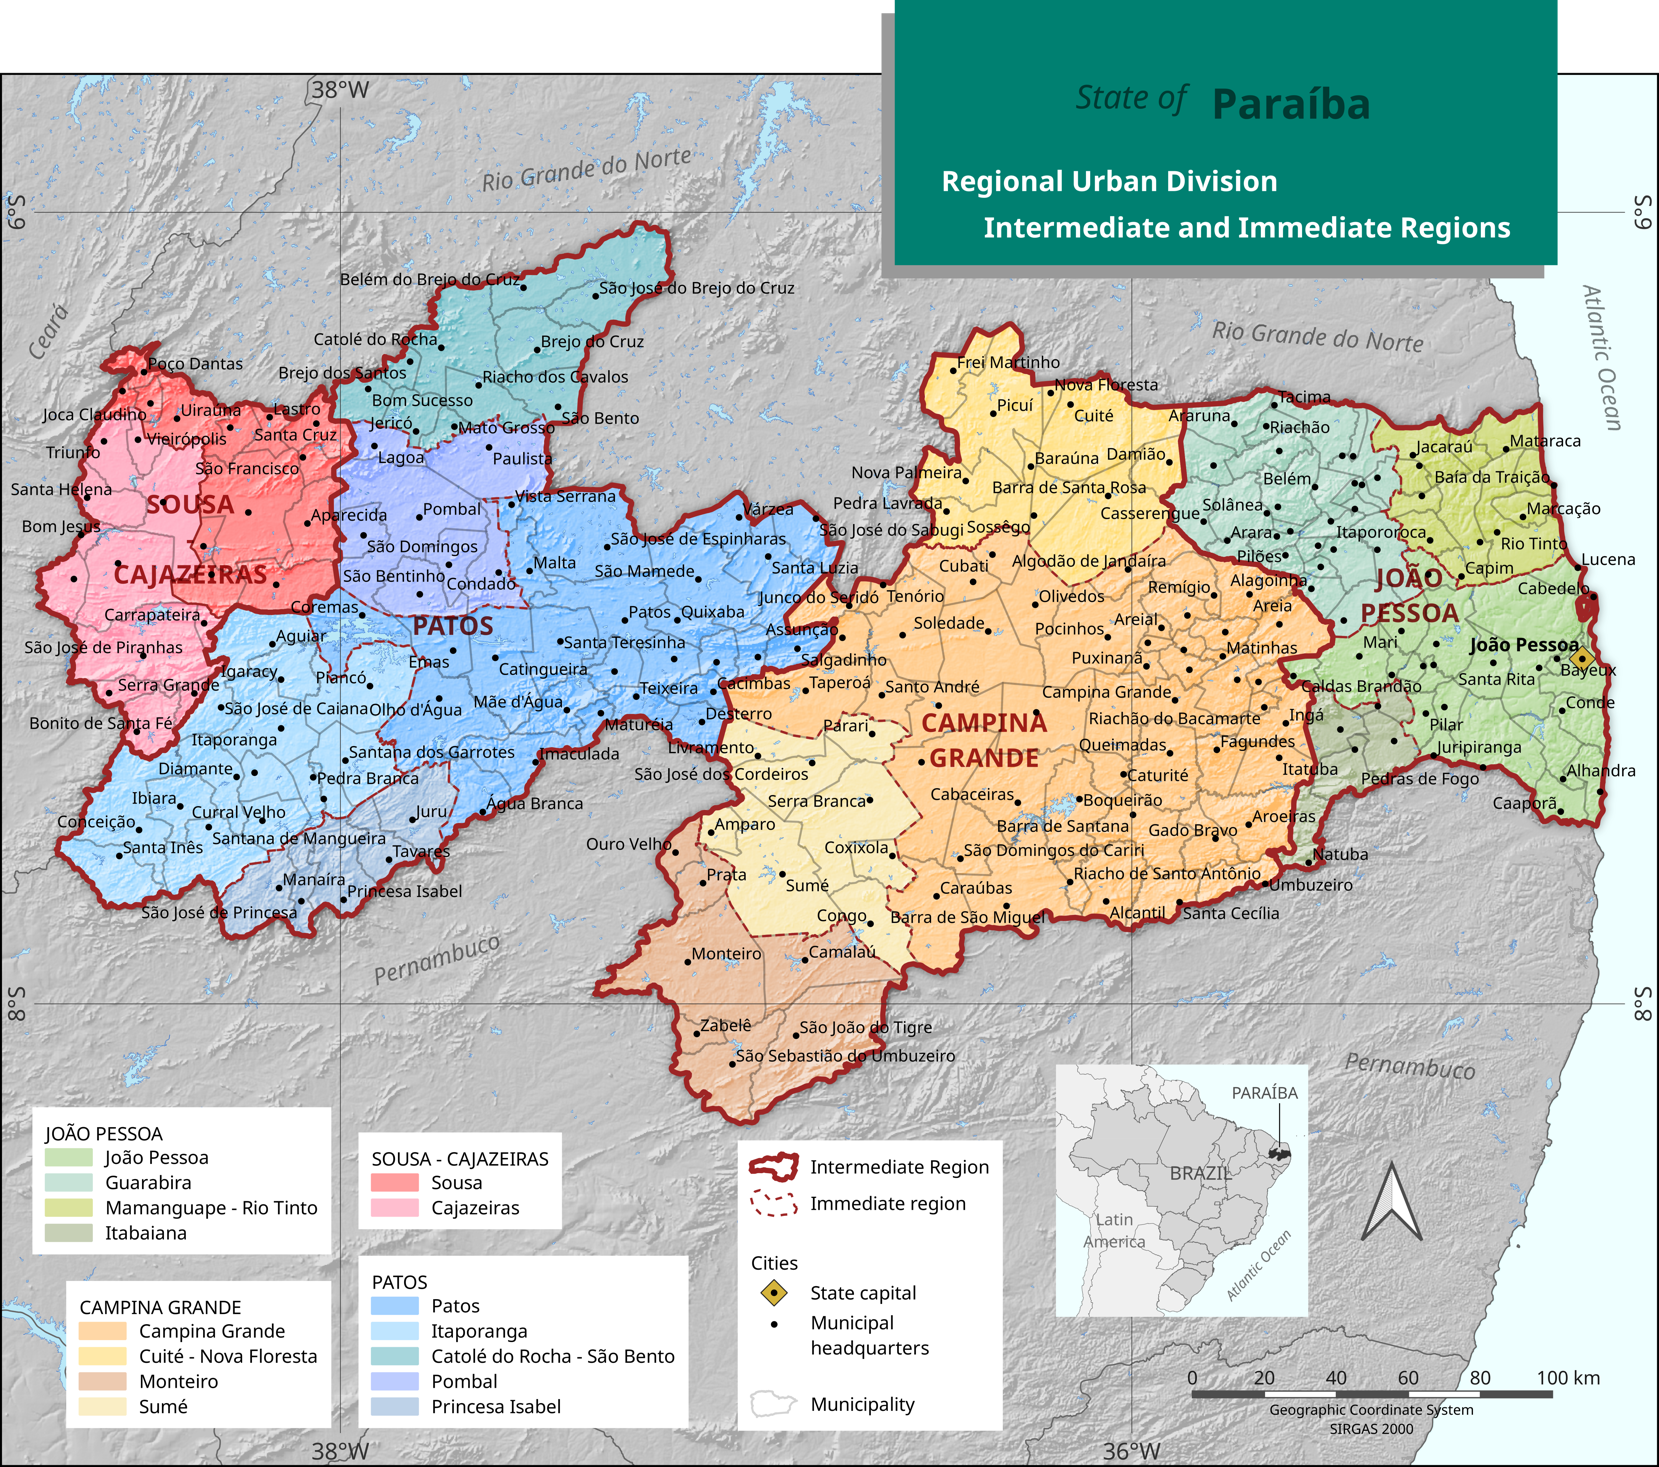
Paraíba occupies an area of around 56,470 km² (about 0.7% of the Brazilian territory) located between latitudes 6° 1' 33" S to 7° 9' 18" S and meridians 34° 47' 34" W and 38° 45' 56" W as shown in Figure 1.1. Its borders meet the Atlantic Ocean to the east and the state of Ceará to the west. The southern and northern borders are delimited by the states of Pernambuco and Rio Grande do Norte, respectively.
The state of Paraíba comprises 223 municipalities, according to the division established by the Brazilian Institute of Geography and Statistics (IBGE). As shown in Figure 1.1, the territory of Paraíba is classified into Intermediate and Immediate Geographic Regions for purposes of territorial organization and planning of public policies. The geographic regions are named below, addressing the intermediaries' regions and their respective immediate members:
Click on the image to enlarge
Figure 1.1 - Map of the Urban Regional Division of the State of Paraíba.
Source: IBGE/Geography Coordination/Urban-regional division of Brazil, 2021.
The Government of the State of Paraíba adopts a classic socioeconomic division that aggregates its main economic spaces in the following geoeconomic zones: Litoral-Mata, Agreste-Brejo, and Semiarid. The Litoral-Mata corresponds to most of the João Pessoa Intermediate Region, defined by the IBGE in 2021, and includes thirty of the 223 municipalities in the State, that is, with an area of 5,242 km² (9.3% of the State's territory). The Agreste-Brejo covers almost entirely the Campina Grande Mesoregion and part of Patos, as defined by the IBGE in 2021, bringing together 48 municipalities with a total area of 7,684 km² (13.6% of the entire surface of the State). The semi-arid zone of Paraíba covers an area of approximately 51,306 km² (87.0% of the state's total), including about 223 municipalities. This is according to the Ministry of National Integration and the Superintendence of Northeast Development (SUDENE), through the Resolution of the Deliberative Council (CONDEL) of SUDENE No. 107, of July 27, 2017, Technical Note No. 0023/2017-SUDENE /DPLAN/CGEP, of November 20, 2017, and CONDEL Resolution of SUDENE No. 115, of November 23, 2017.
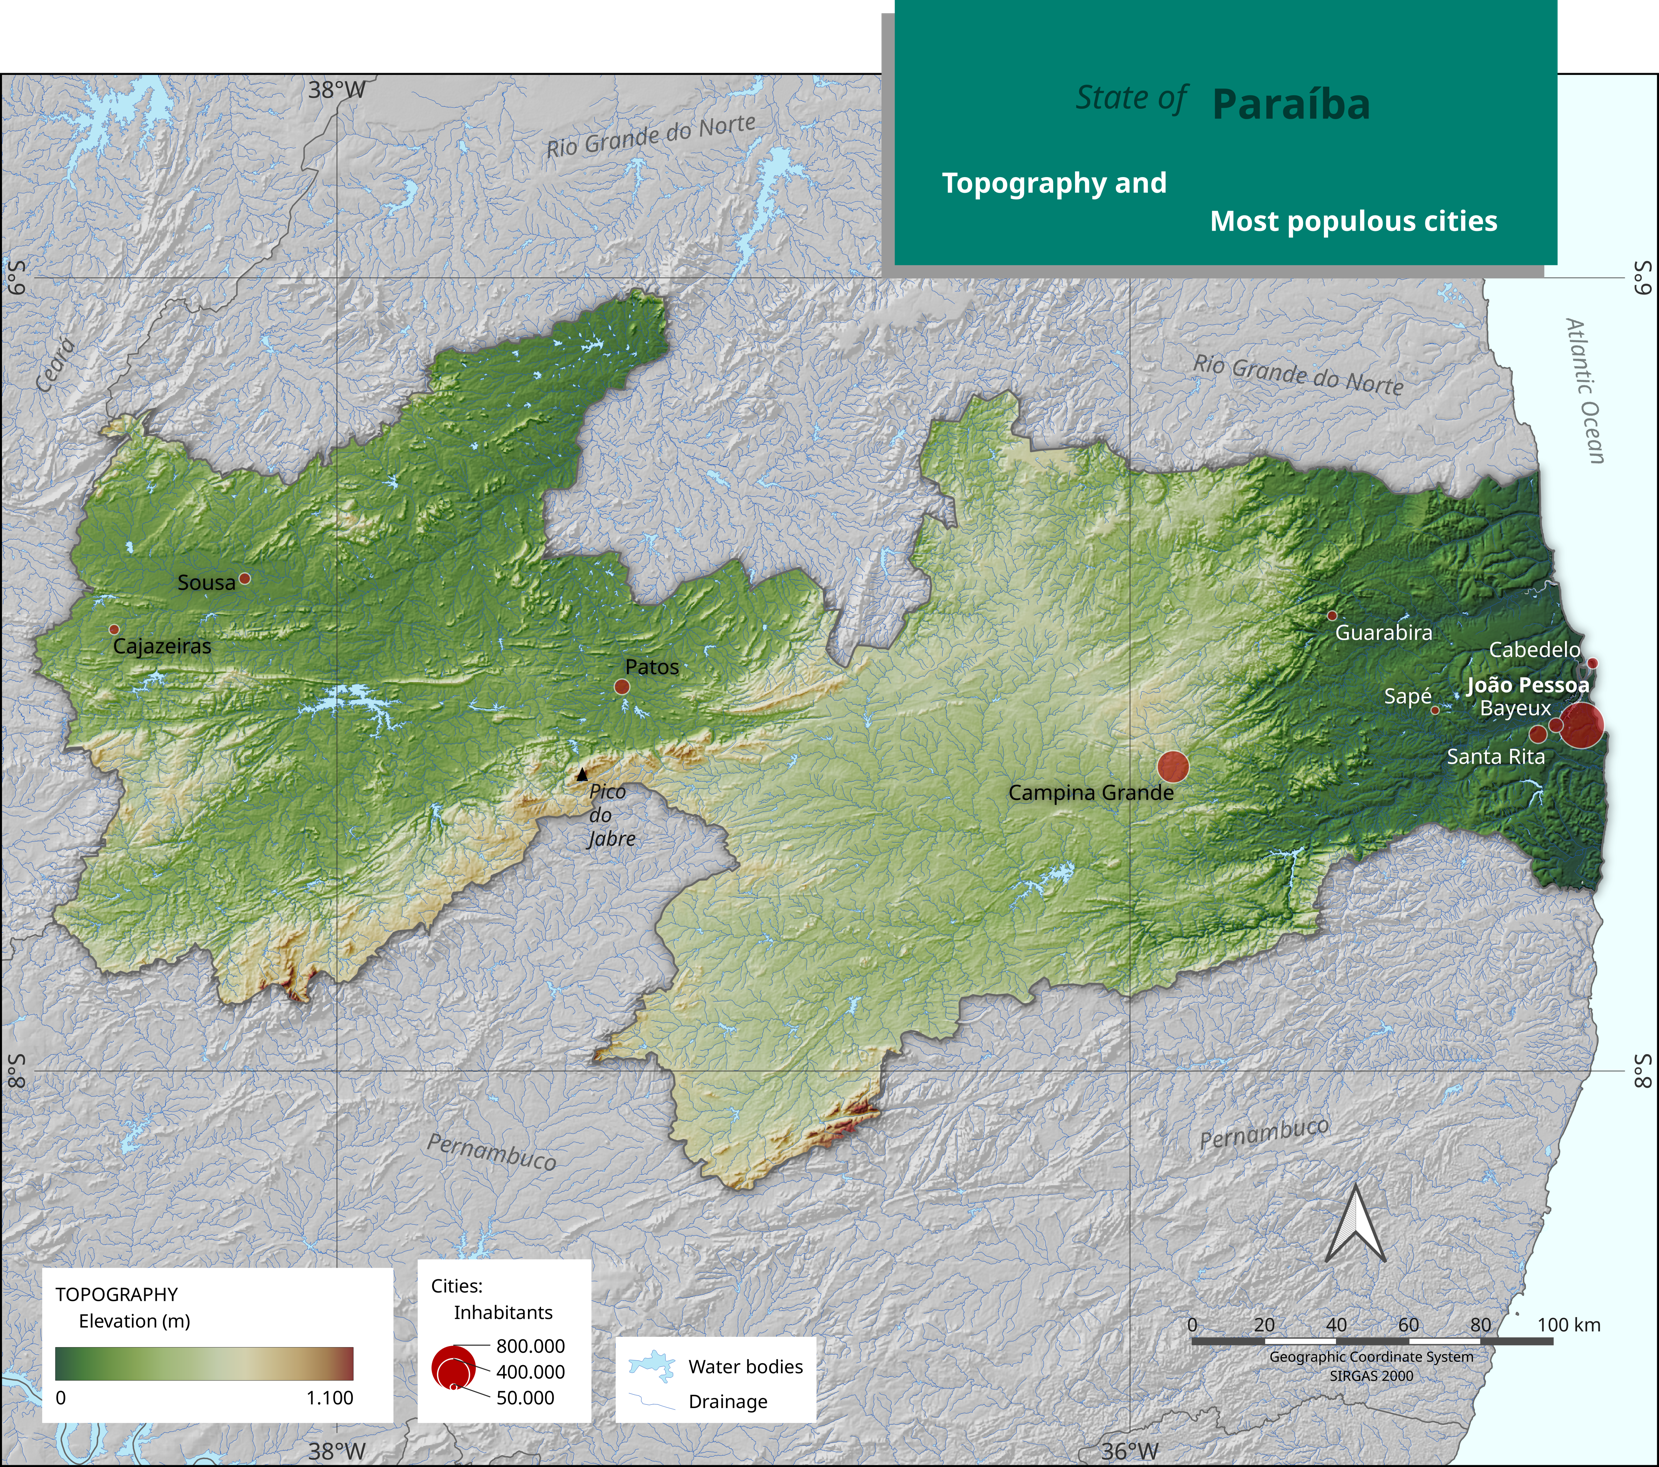
Figure 1.2 presents the topography of the State of Paraíba. A lowland coastal strip, the Borborema Plateau in the central region and the Western Plateau characterize the Paraíba's relief. Approximately 90% of the territory of Paraíba has altitudes below 600 m, with the highest elevations located along the Planalto da Borborema, the highest point being the peak of Jabre, with an altitude of 1,090 m. The Atlantic Coast is about 120 km long, where cliff-type formations occur, with altitudes below 60 m. The Sertaneja Depression dominates the relief in the west of the Paraíba's territory, characterized by the Caatinga and the semi-arid climate, with elevations varying between 100 m and 400 m.
Click on the image to enlarge
Figure 1.2 - Topography of the state of Paraíba and location of the largest cities.
Sources: NASA/SRTM 4.1 and IBGE/Cartographic Base BC250, 2021; Demographic Census, 2022.
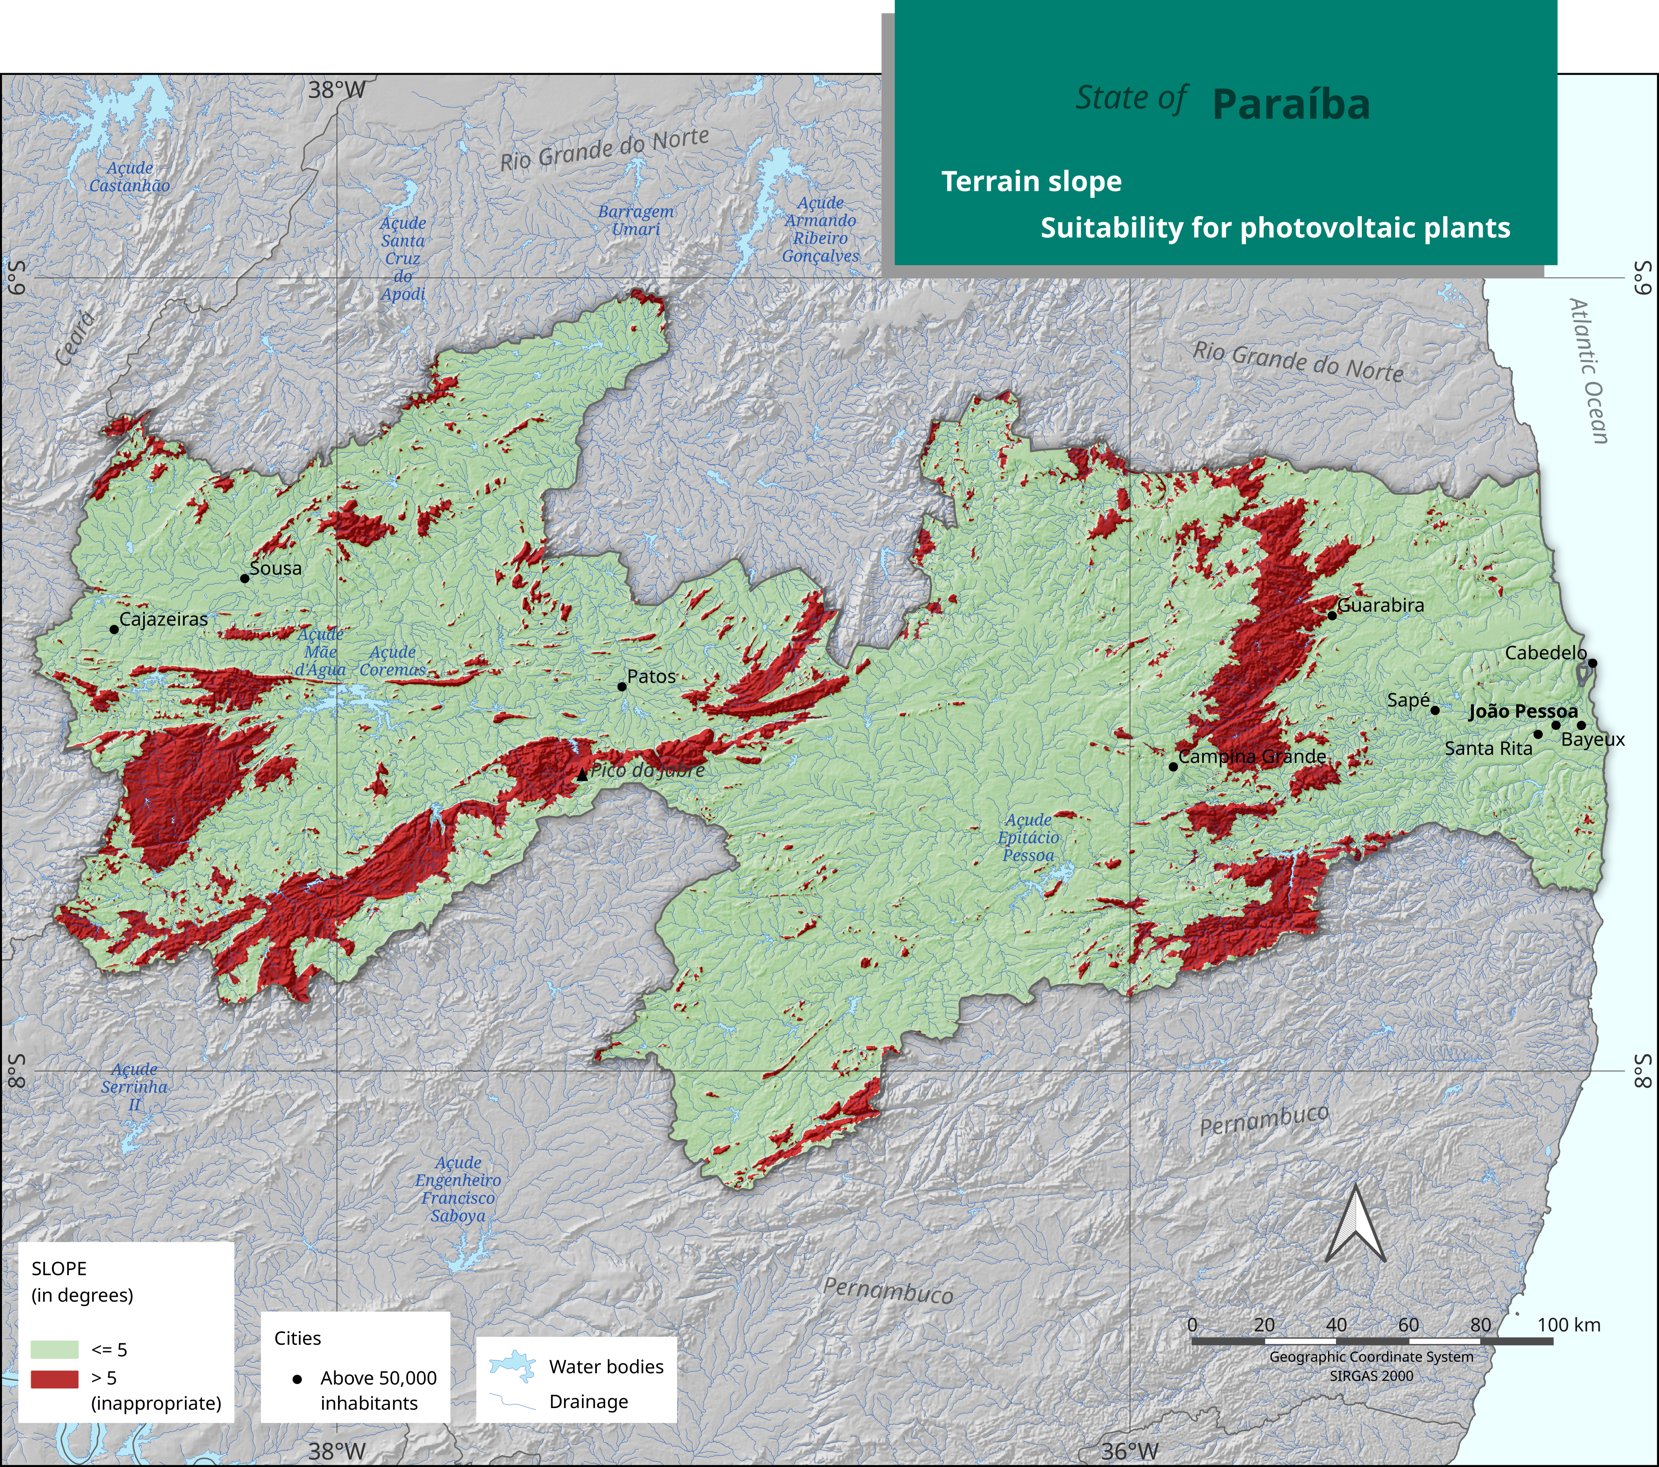
Figure 1.3 shows the land slope map for Paraíba's territory. The land slope is critical for identifying the best location sites for large-scale photovoltaic power plants. The literature points out that places with land slopes greater than 5 degrees (or 8.7%) should be avoided due to aspects related to surface runoff and risks of soil erosion processes (Guarnieri, 2017; Al Guarni & Awasthi, 2017).
Click on the image to enlarge
Figure 1.3 - Map of the land slope, including the location of the largest cities.
Sources: Derived from NASA/SRTM 4.1; IBGE/Cartographic Base BC250, 2021.
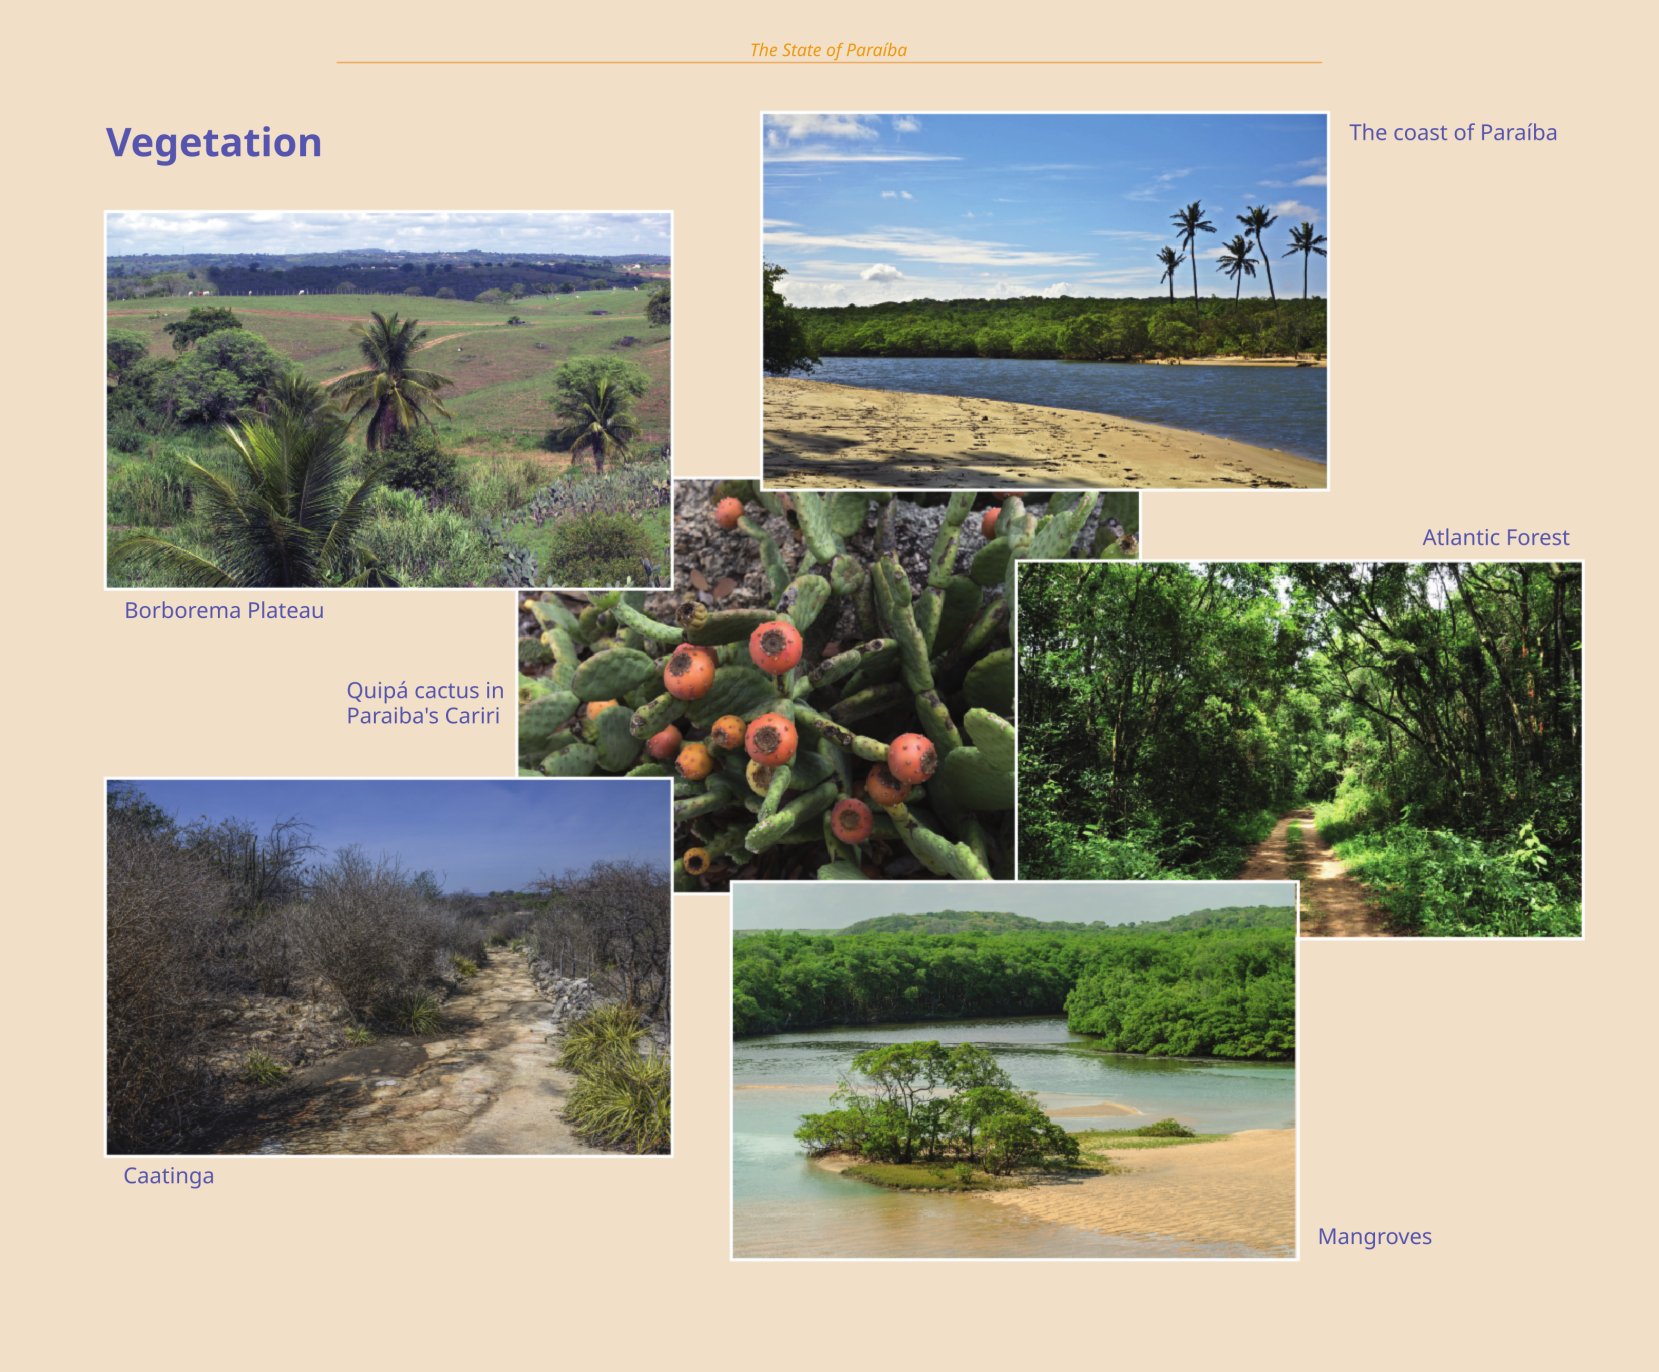
Paraíba's ecological richness is reflected in its diverse vegetation, which includes the Caatinga and Atlantic Forest biomes and a variety of species adapted to different climates and environments.
According to the Brazilian Forest Service (2019), Paraíba has at least 11 types of vegetation as forests, including Savannah-Steppic Wooded and Forested (Caatinga), Seasonal Semi Deciduous Forest, Open Ombrophilous Forest, Wooded and Forested Savannah, Mangrove, Palm grove, Sandbanks, and Planted Forests, where more than one typology occurs. The Savanna-Stépica (Caatinga) is the predominant typology, covering approximately 94% of the natural vegetation areas in the state (SFB, 2019).
There are significant differences in the number of plant species recorded in the State of Paraíba between the Flora and Funga Project of Brazil (2023), which indicates 2390 species, and the SpeciesLink platform (CRIA, 2023), which records 4318 species, including angiosperms, ferns, and lycophytes.
Click on the image to enlarge
Paraíba, as part of the Brazilian Northeastern region, experiences high temporal and spatial precipitation variability. The most active atmospheric systems in the Semiarid Zone are the Intertropical Convergence Zone (ITCZ), the Southern Oscillation Events (ENSO) – El Niño and La Niña, the High-Level Cyclonic Vortex (VCAN) and the Frontal Systems (Cold Fronts), which are responsible for the rainfall distributed throughout the year. The ZCIT influence is more intense in the Semiarid region during March and April, when it is positioned over the Southern Hemisphere.
Among the typical precipitation regimes observed in the NEB, two of them affect the State of Paraíba: the first is characterized by a well-defined rainy quarter between February and May and comprises the regions of SousaCajazeiras and Patos, and the most to the west and north of the Campina Grande region, with the main meteorological phenomena being the ITCZ, the convergence of humidity from breezes and Trade Wave Disturbances (POAs) and local convection (Molion & Bernardo, 2002).
The second regime is characterized by a rainy four-month period between April and July, comprising the eastern portion of the state (João Pessoa region), caused by the increase in breeze circulation activity and maximum convergence of the trade winds with land breezes (Kousky, 1979), by the wave disturbances from the east (Ferreira et al., 1990) and by the displacement of a convergence zone observed over the east coast of the Northeast (Molion & Bernardo, 2000). These are the major weather systems responsible for precipitation in the state.
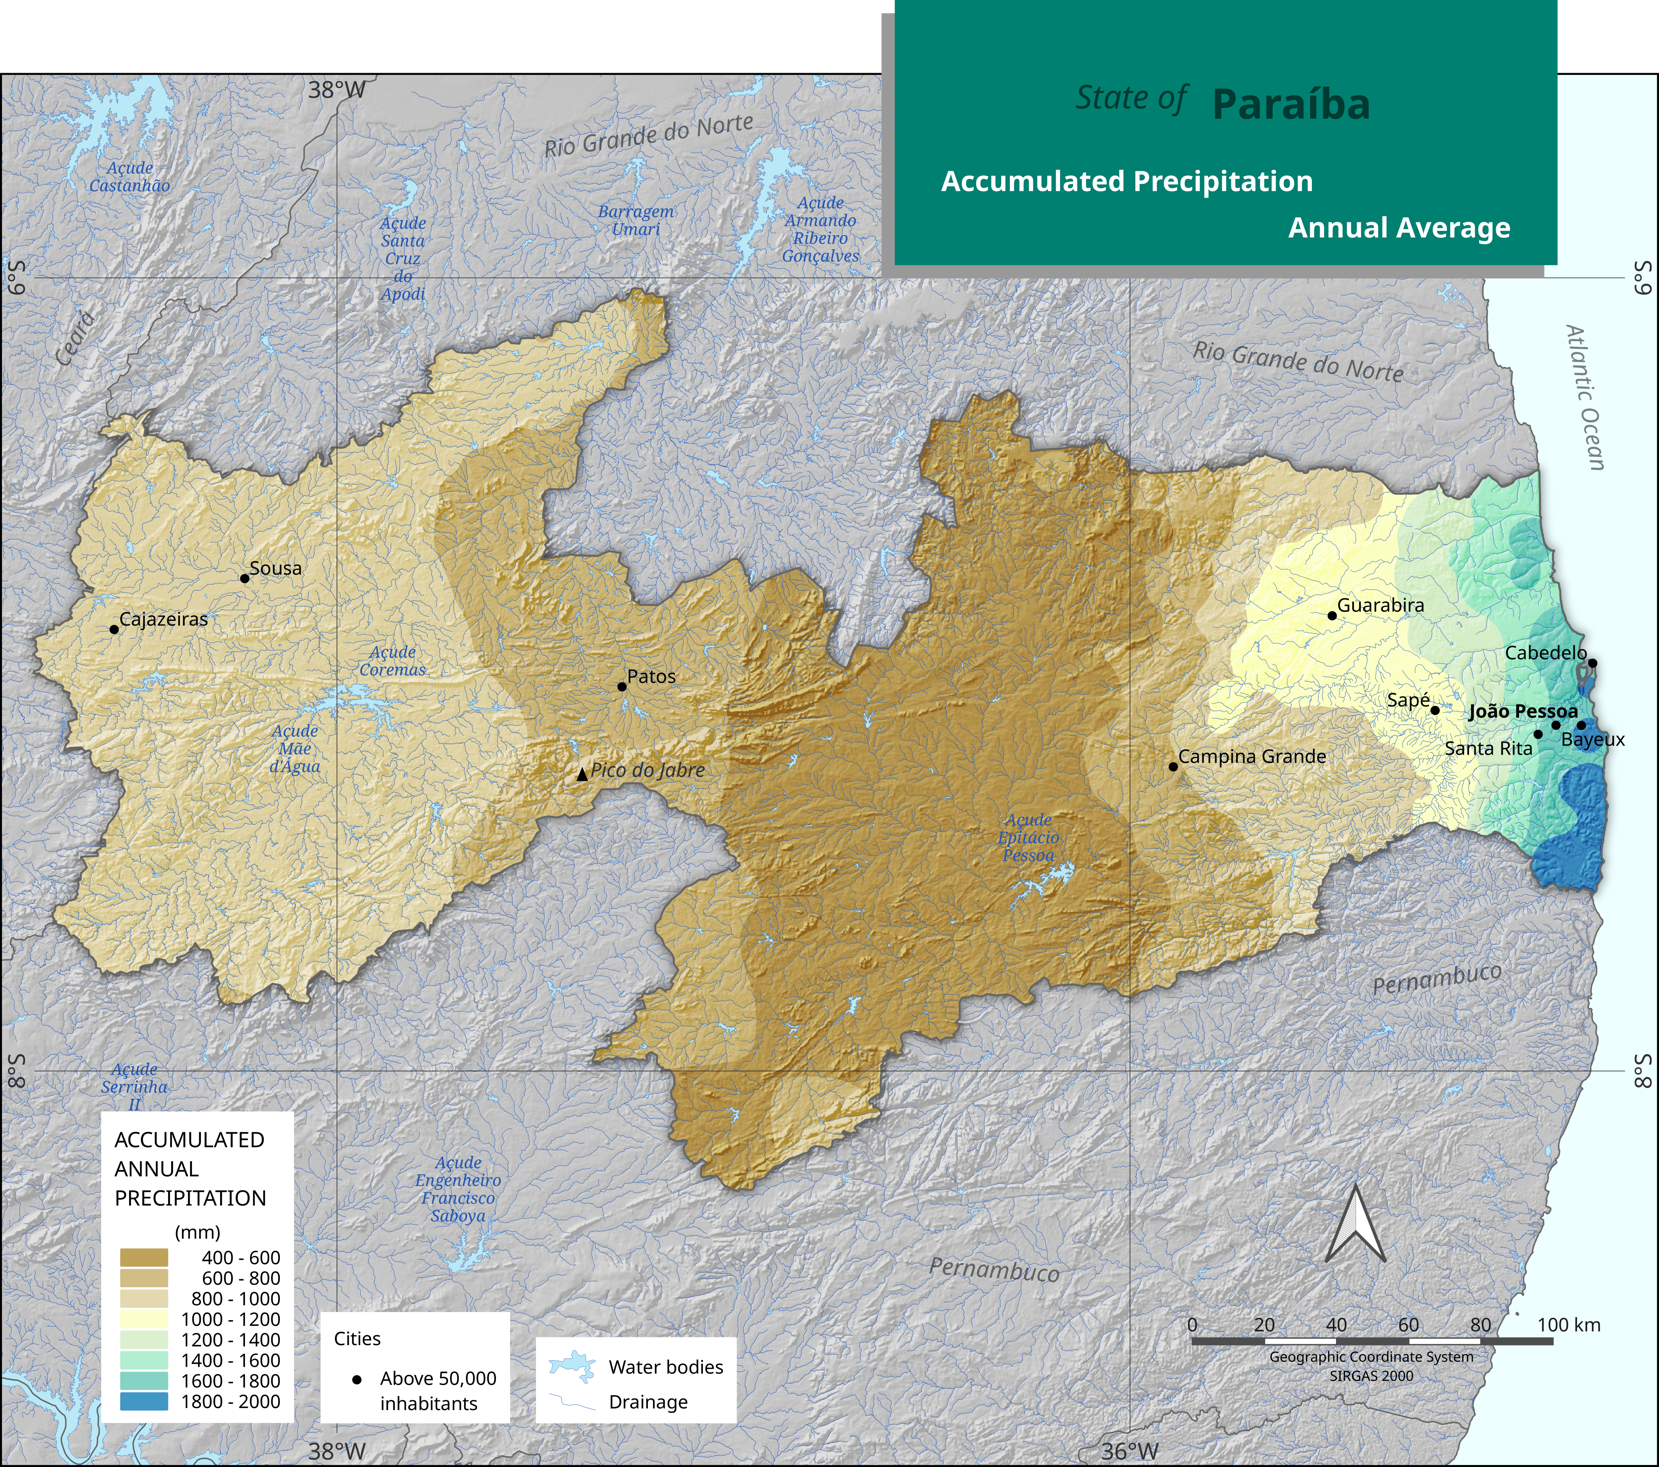
As shown in Figure 1.4, the annual distribution of precipitation shows high spatial variability. The state's central portion, including the intermediate region of Campina Grande and the west of the João Pessoa region, presents the lowest annual accumulated precipitation values between 400 and 600 mm. The region of Sousa-Cajazeiras and the west of the region of Patos present annual precipitation between 800 and 1000 mm, and the easternmost portions of the state present values above 700 mm, with emphasis on the region of João Pessoa, where the annual accumulated range from 1200 to 1600 mm. Precipitation is an important climatic element, as it promotes temperature regulation and controls extreme thermal amplitudes.
Click on the image to enlarge
Figure 1.4 - Map of the spatial distribution of precipitation.
Sources: G. Köppen's climate classification map for Brazil; IBGE/Cartographic Base BC250, 2021.
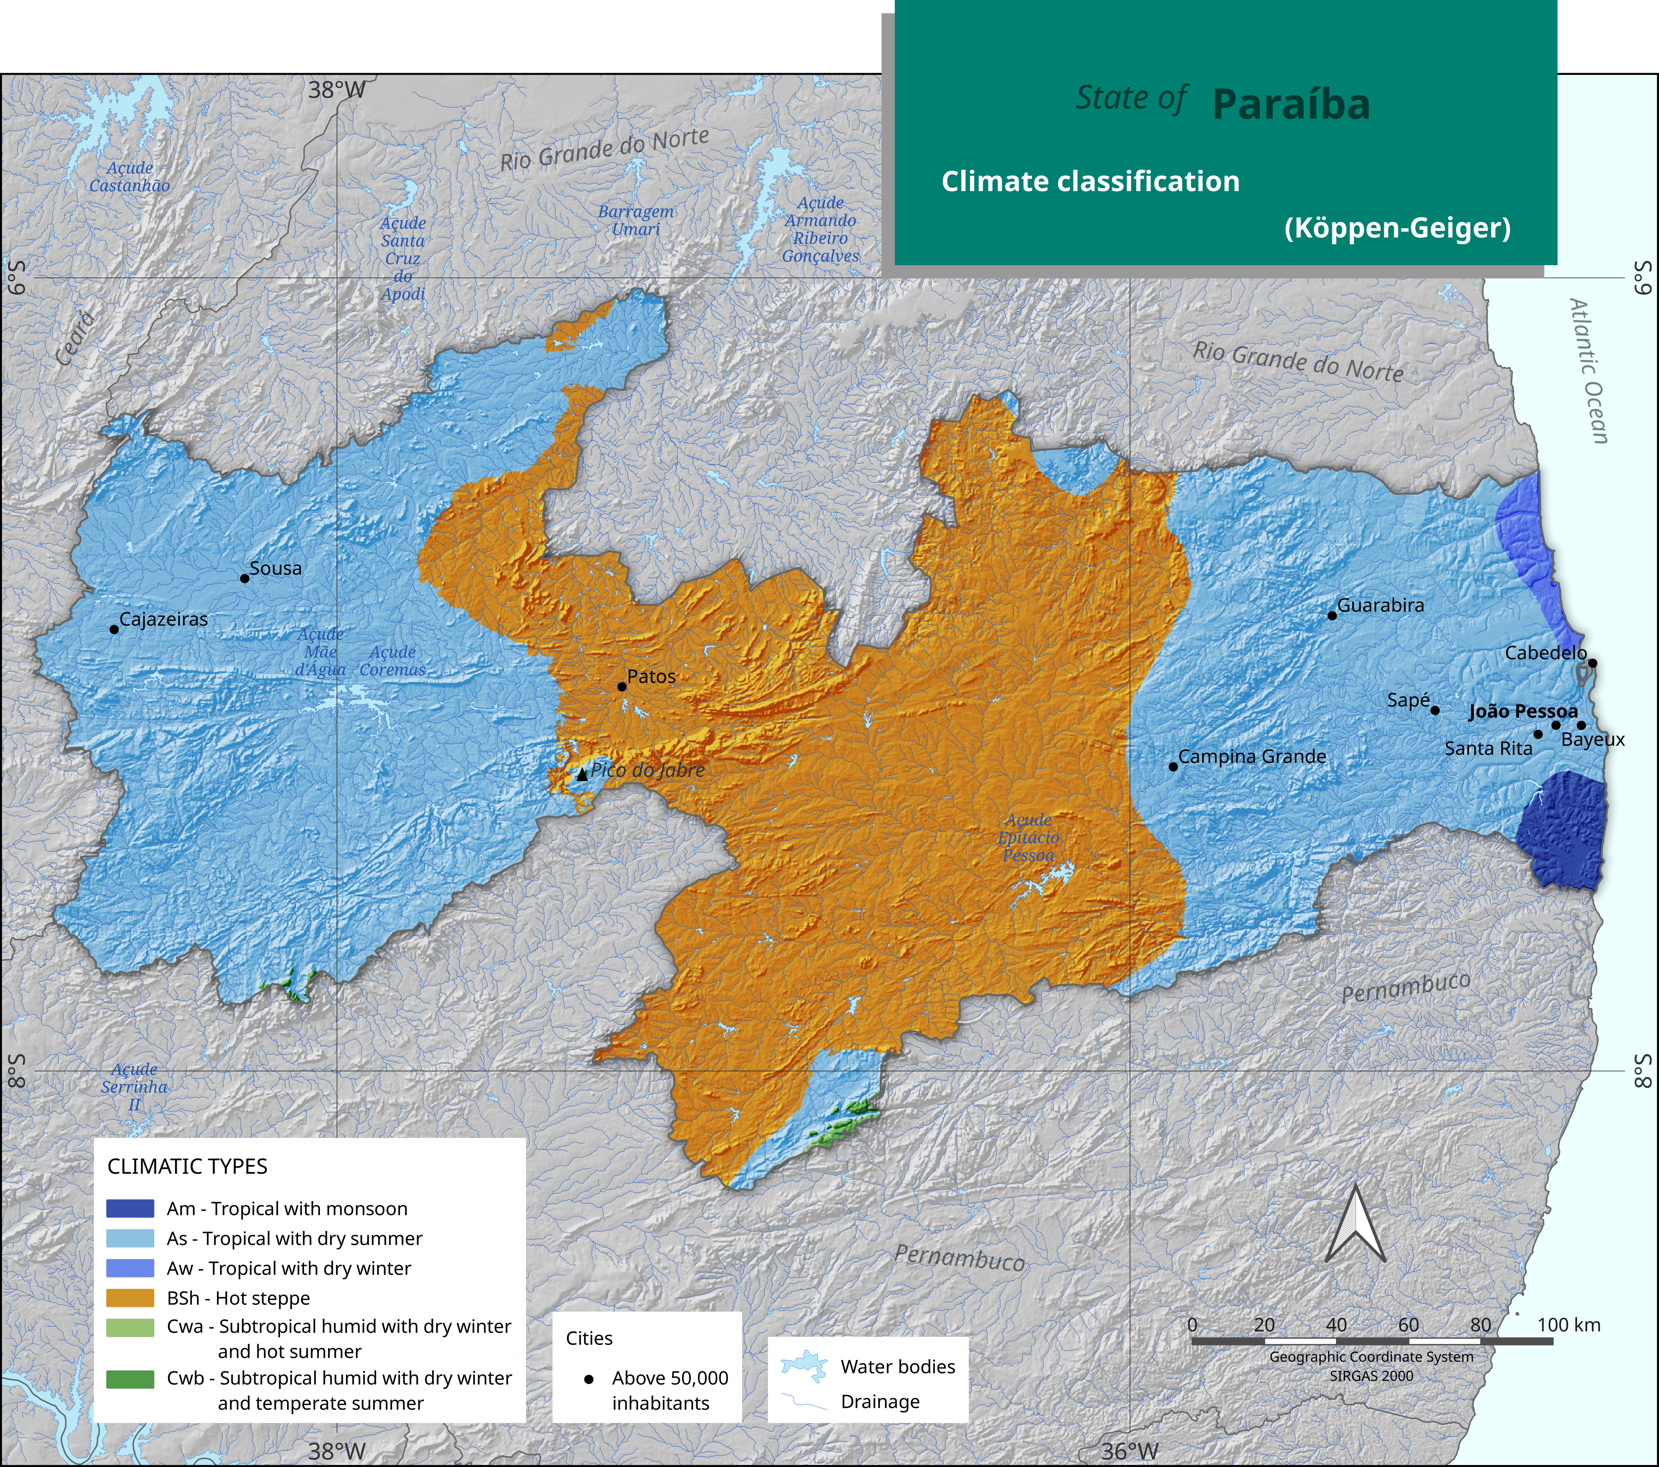
According to Francisco and Santos (2017), the Köppen climate classification shows the predominance of types "As" (tropical climate with dry summer) and "Bsh" (hot semi-arid climate) in the state of Paraíba, as shown in Figure 1.5. Type "As" is observed in the east of the João Pessoa region, in addition to a range in the western and northern portions of the Patos region. The "Bsh" climate type occurs in the state's central region, comprising the region of Campina Grande and the west of João Pessoa. It is noteworthy to mention that in Paraíba's central area, annual rainfall ranges between 400 and 600 mm (Figure 1.4), and is, therefore, one of the regions with the lowest rainfall totals in the country.
Click on the image to enlarge
Figure 1.5 - Map of the distribution of climate types according to Köppen.
Sources: G. Köppen's climate classification map for Brazil; IBGE/Cartographic Base.
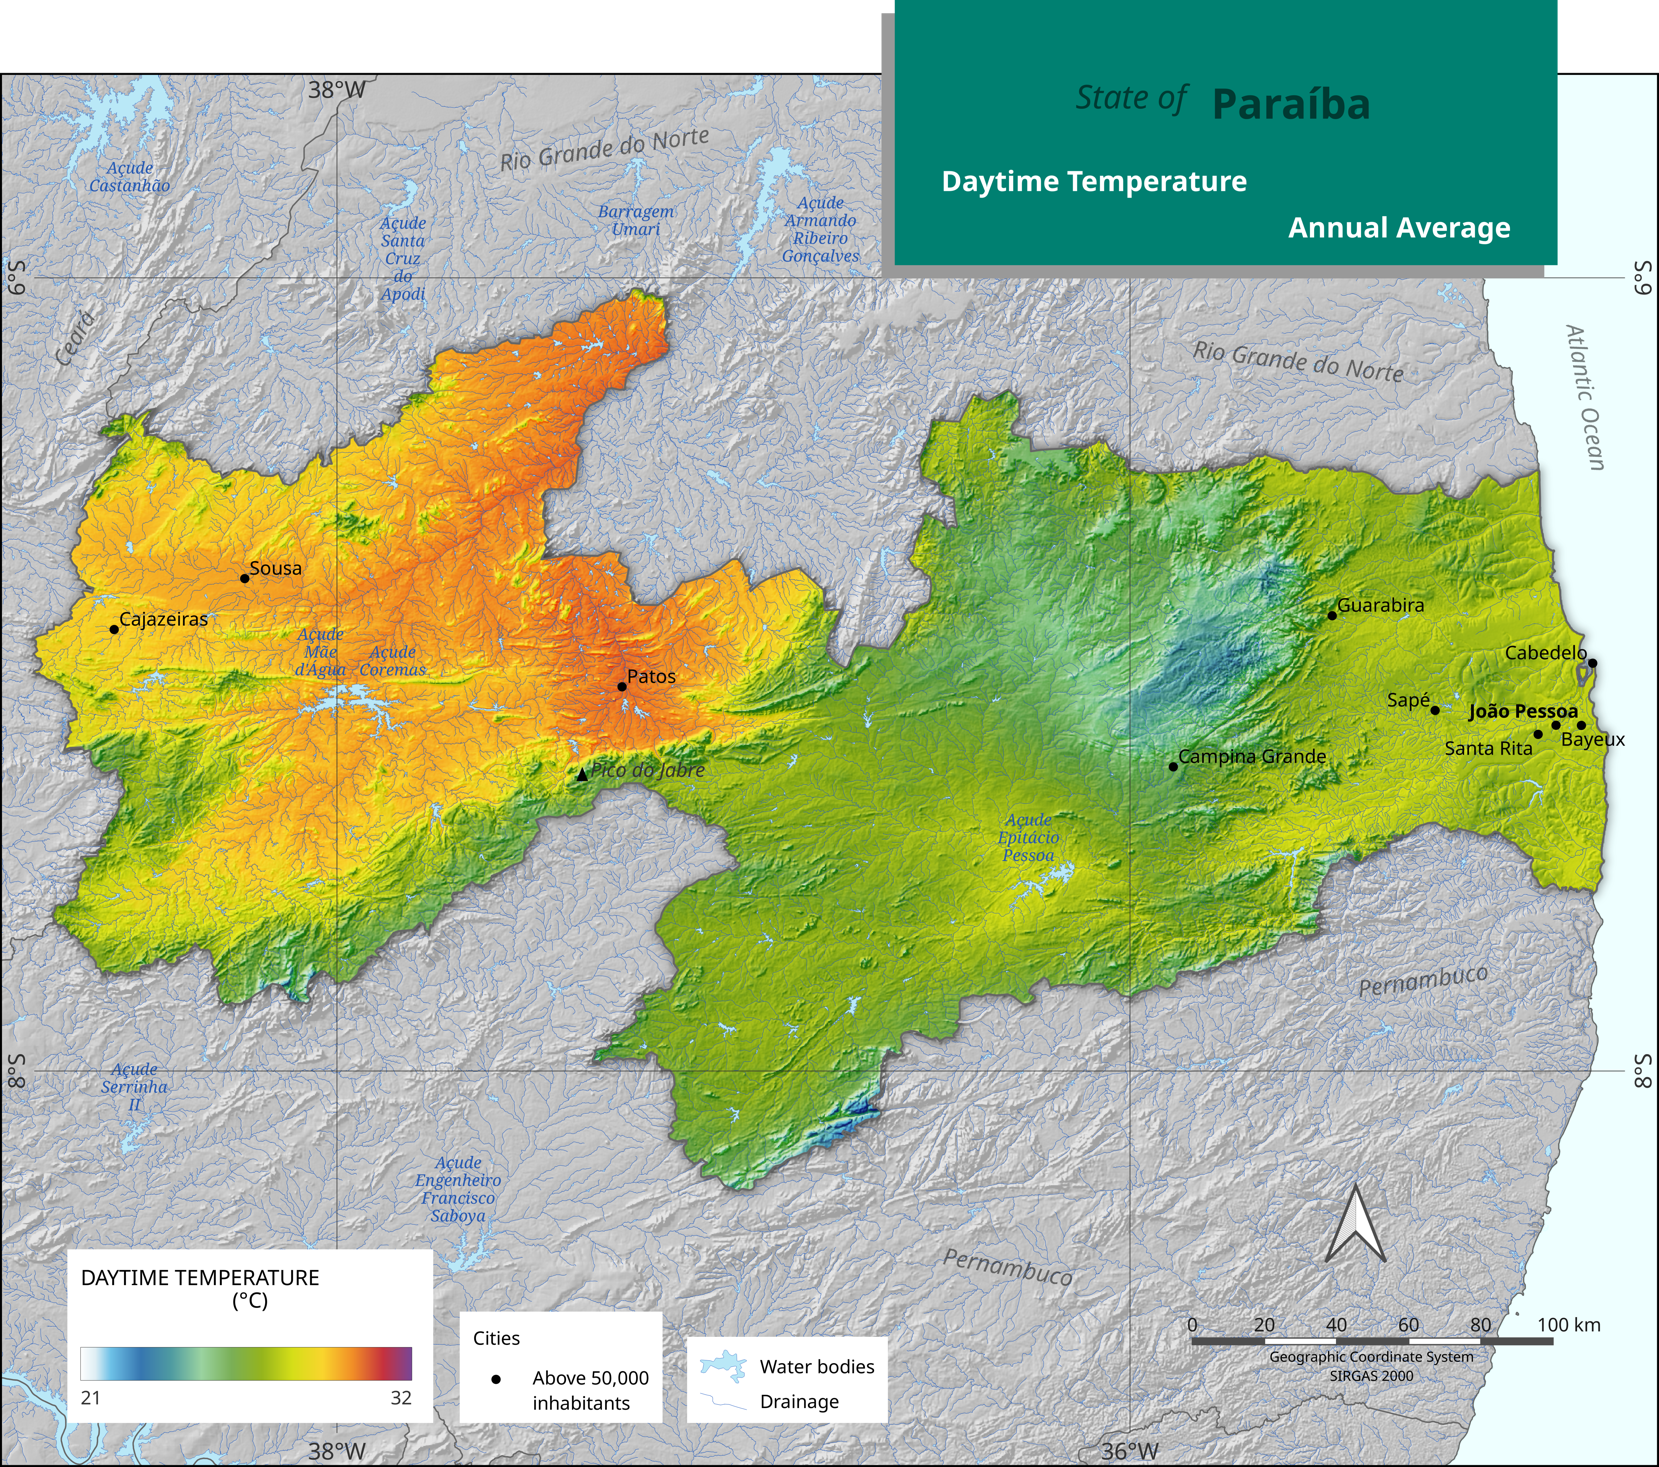
Figure 1.6 shows the average annual diurnal air temperature distribution in Paraíba. The map highlights the central-north portion of Campina Grande with the lowest values. In contrast, the eastern sector of Patos, with low altitudes, has the highest average diurnal air temperatures throughout the year. The temperature pattern is consistent throughout the year, with the lowest values occurring in June, July, and August and the highest in October, November, and December.
Click on the image to enlarge
Figure 1.6 - Map of daytime temperature and principal cities.
Sources: INMET/Automatic Stations; IBGE/ Cartographic Base BC250, 2021; Demographic Census, 2022.
Paraíba territory has rivers and streams described as lotic bodies of water or natural watercourses (intermittent, ephemeral, perennial, and perennial), which have their terminologies established in Art. 2 of the Resolution of the National Water Resources Council (CNRH) No. 141, of July 10, 2012. Most of these lotic water bodies or natural water courses are represented in the framework of the water bodies of Paraíba, prepared by the Executive Agency for Water Management (AESA) and updated in partnership with SUDEMA in 2014. These aspects of water resources management are based on Guideline No. 201 of the State Licensing System for Polluting Activities (SELAP) in 1988. They can be viewed at the Spatial Database (BDE) of the SIG-WEB of the Executive Agency for Water Management (AESA) through the electronic address http://siegrh.aesa.pb.gov.br:8080/aesa-sig/.
The Government of Paraíba established, in Complementary Law 168/2021, the water and sewage micro-regions of Alto Piranhas, Espinharas, Borborema, and Litoral. The structure considers, among other aspects, the delimitation of watersheds, the division of the operational infrastructure of basic sanitation services, and the social, economic, and political particularities of the territories involved.
The low annual rainfall is a constraint factor for the hydrographic regions in the Semi-Arid Zone of Paraíba, causing less flow and surface runoff in rivers and streams. In these localities, the hydrographic characterization is characterized by intermittent and ephemeral rivers and streams.
The hydrographic basins of Paraíba are composed essentially of perennial rivers, the Abiaí, Guaju, Mamanguape, Miriri, Gramame, and Camaratuba, as well as the Baixo Paraíba hydrographic sub-basin.
Paraíba has numerous reservoirs and dams built to mitigate the impact of dry seasons, such as diffuse demands (human supply of rural populations, animal watering, and irrigation).
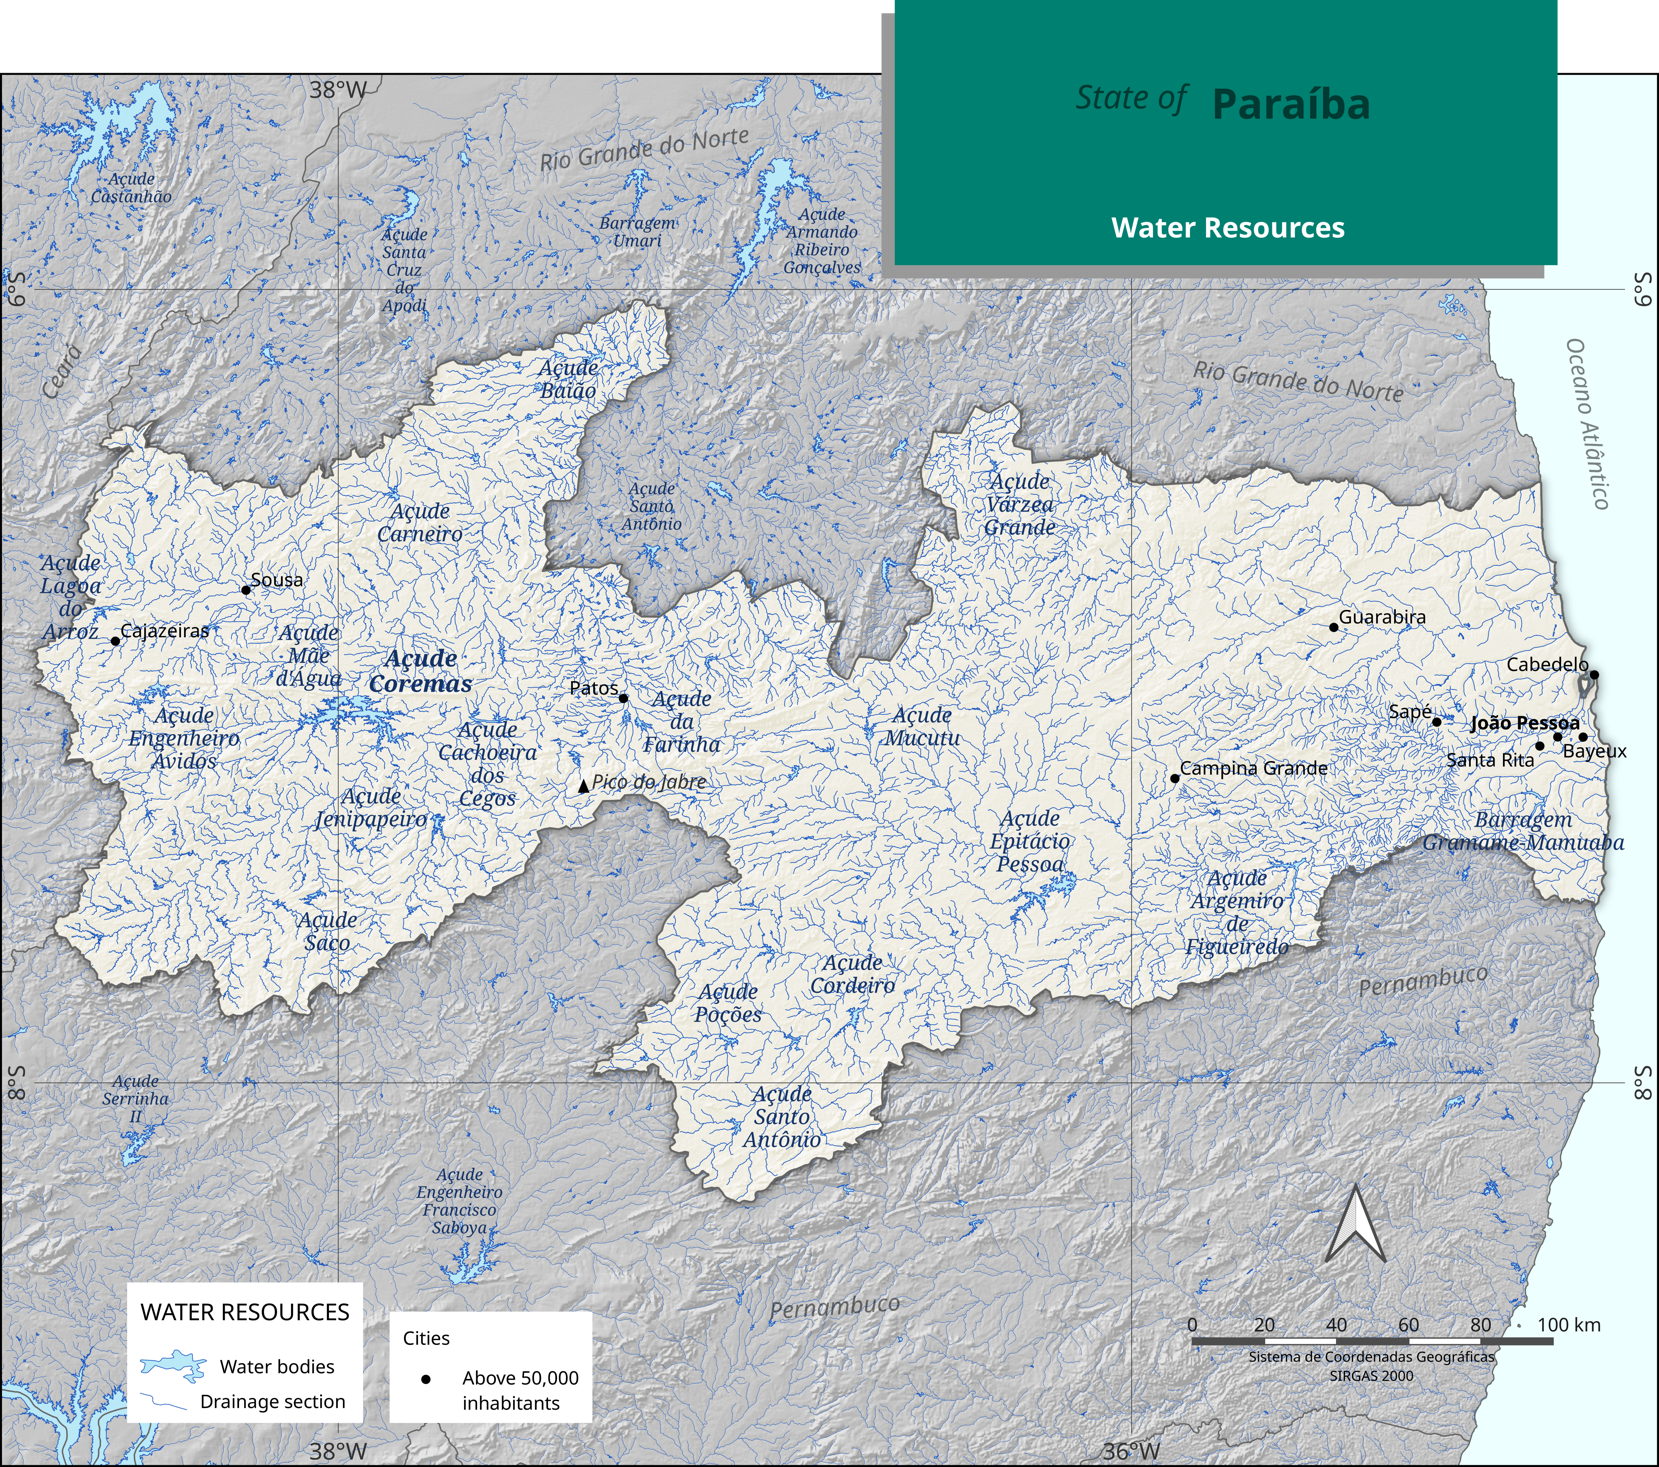
The Coremas Dam, the largest in the state in terms of storage capacity, with approximately 590 hm³ and located in the Piancó River basin, benefits 112 municipalities spread across the Mesoregion of Sertão Paraibano (AESA, 2020). Figure 1.7 presents the map of water resources in Paraíba used to prepare the economic scenarios described later in this document.
Click on the image to enlarge
Figure 1.7 - Map of state water resources and major cities.
Source: ANA/Massas d'Água, 2021; IBGE/Cartographic Base BC250, 2021; Demographic Census 2022.
Conservation Units are lawfully protected territories established by the Government that aim to conserve the environmental resources within their boundaries, including jurisdictional waters, with relevant natural characteristics. For them, a special administration regime is mandatory, to which adequate protection guarantees apply.
Such protected territories are classified into two groups, according to their type of use: Integral Protection and Sustainable Use. Each of these groups is subdivided into five and seven categories, respectively, which adapt to the environmental reality of each location.
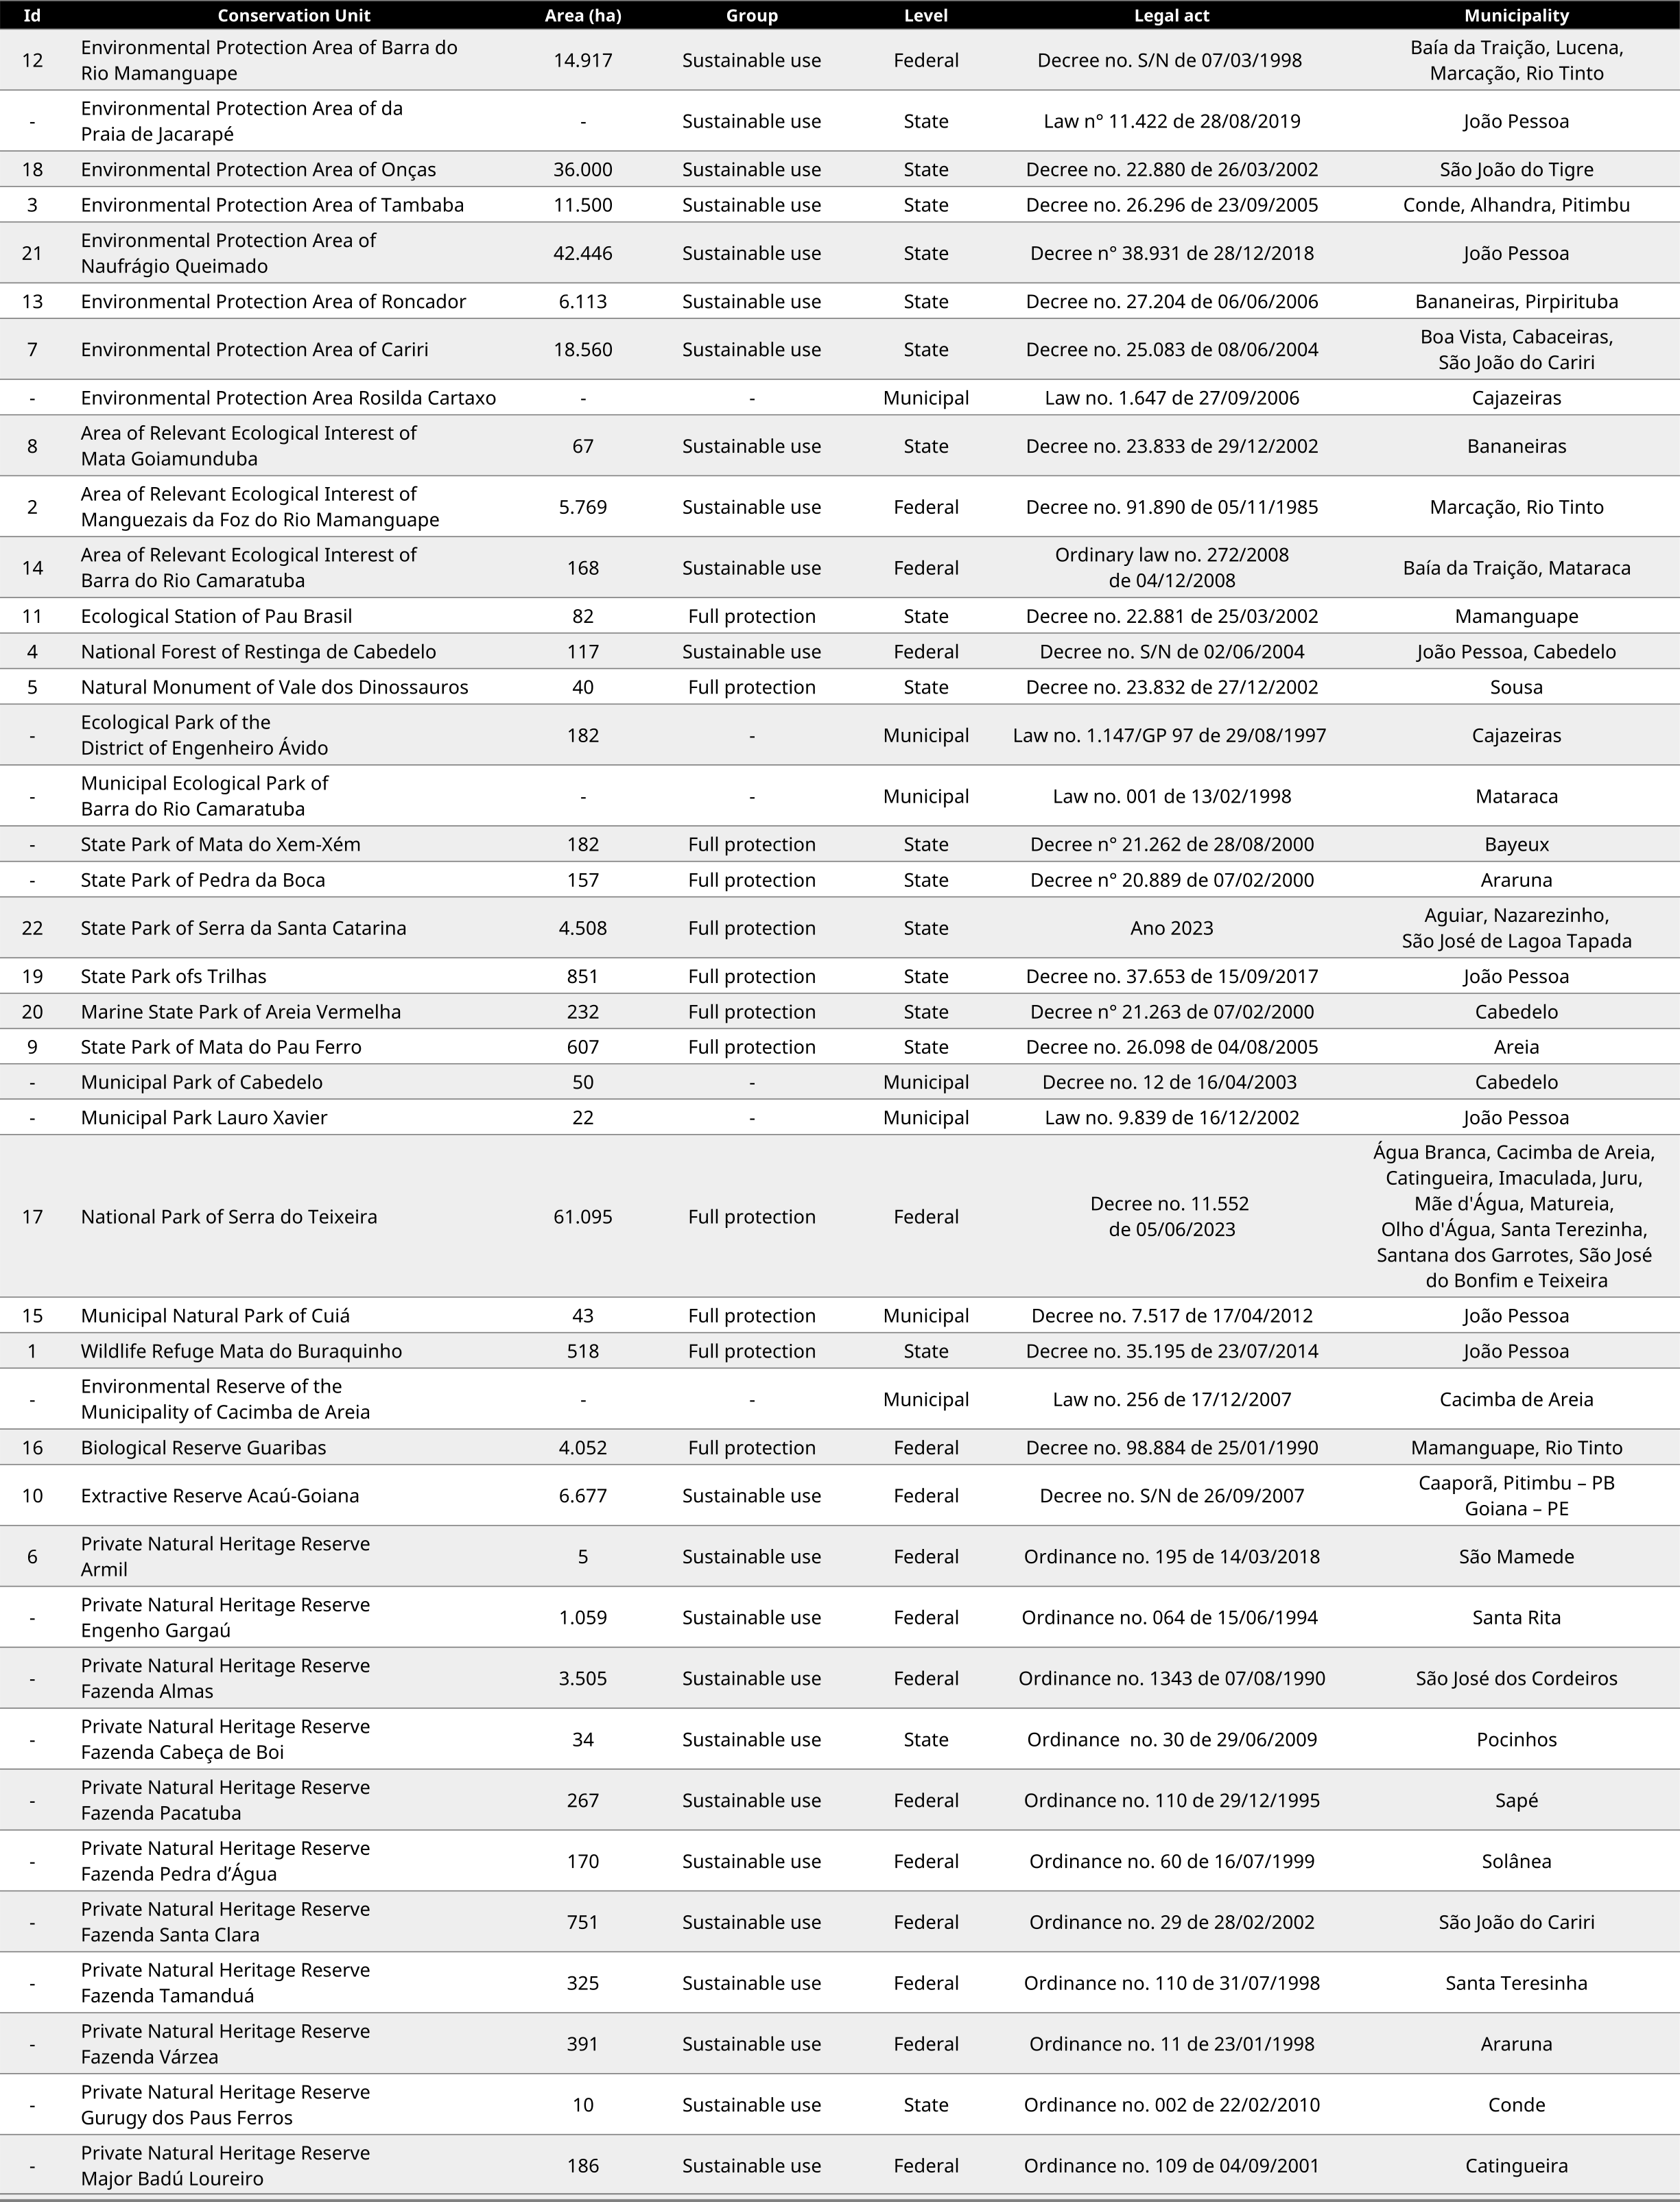
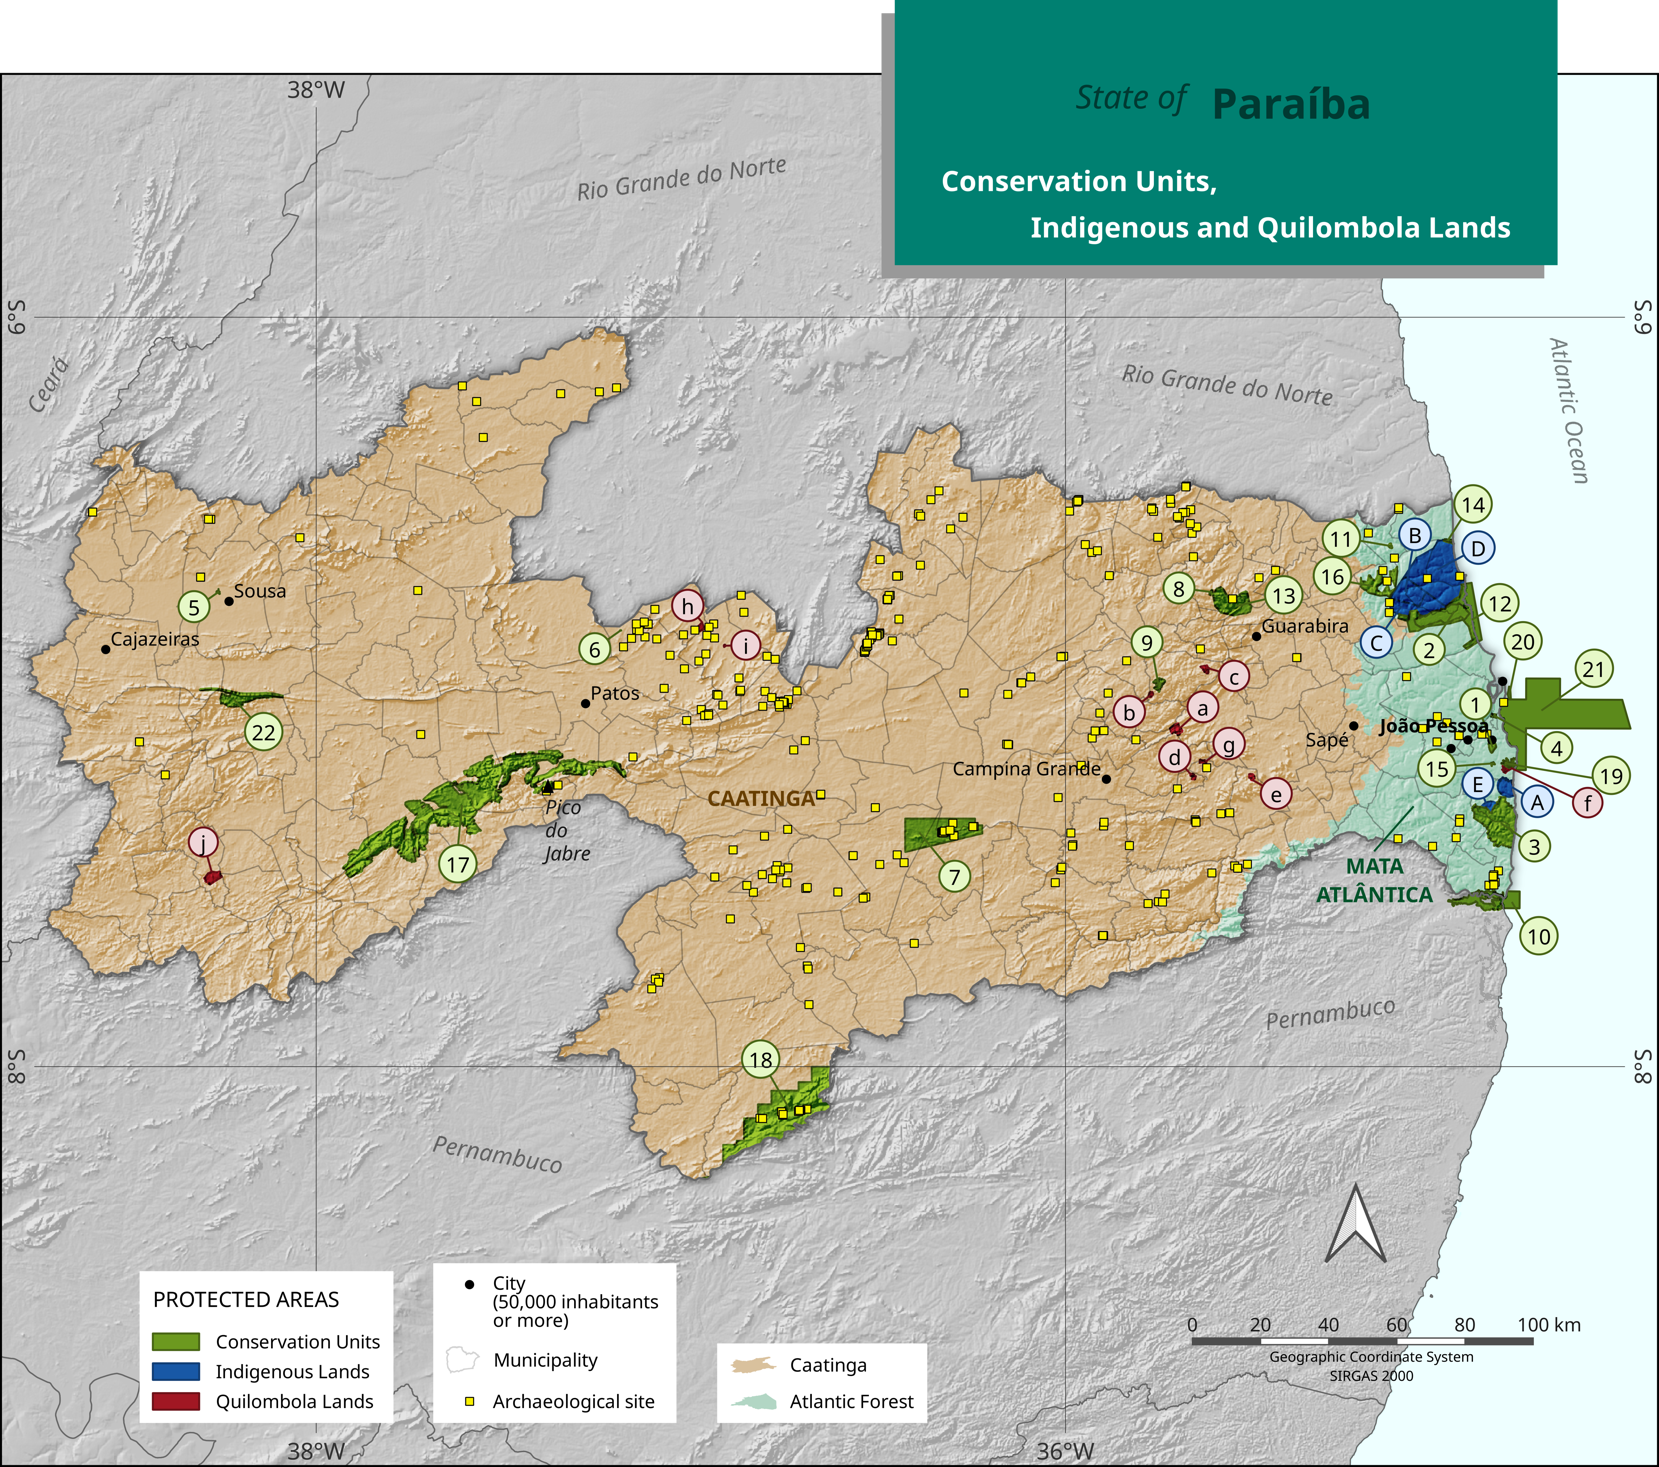
In total, there are 40 Conservation Units in Paraíba, listed in Table 1.1, 17 of which are managed by the state through SUDEMA, another 16 at the federal level by the Chico Mendes Institute for Biodiversity Conservation (ICMBio), and another seven that are in charge of municipalities. Among the CUs, some are private. Named Private Natural Heritage Reserves, nine are at the federal level and two at the state level. Figure 1.8 shows the map with the location of conservation units.
Table 1.1 - Conservation Units in Paraíba's territory. The numbering (Id) indicates the position on the map.
Source: MMA (Ministry of the Environment)/ICMBIO (Chico Mendes Institute for Biodiversity Conservation), 2021; SUDEMA, Municipalities of Cabedelo, Cacimba de Areia, Cajazeiras, João Pessoa and Mataraca.
Click on the image to enlarge
Click on the image to enlarge
Figure 1.8 - Conservation Units, Indigenous and Quilombolas lands (see table for identification).
Sources: SUDEMA-PB, 2023; MMA/ICMBIO, 2022; FUNAI, 2021, INCRA, 2021; IPHAN, 2021; IBGE/Base Cartográfica BC250
Currently, in Paraíba, Conservation Units are protecting natural landscapes in the two existing biomes in the territory – Atlantic Forest and Caatinga – in addition to others in the marine ecosystem. Several activities can be developed in these protected territories, such as, for example, environmental education, scientific research, ecotourism, and sustainable extraction of renewable natural resources.
Conservation Units preserve critical natural heritage as endangered biodiversity. For instance, numerous Pau-brasil specimens (Paubrasilia echinata) are at the Ecological Station of the same name, which has one of this region's most important germplasm banks in the country. In addition, there are endemic birds (Mata do Pau-Ferro State Park), cave paintings (APA das Onças), and trace fossils from the Cretaceous period (Vale dos Dinossauros Natural Monument) also protected in the Paraíba's conservation units.
Another critical role of Conservation Units is to preserve the traditional knowledge of local communities. The Community Integration Project in the buffer zone of Areia Vermelha Marine State Park (PEMAV) supports women from the Cabedelo fishermen's colony with activities such as crafts produced by Renascer community shellfish gatherers.
Knowledge is a maxim that guides the management of Conservation Units. The belief in a sustainable future where ecosystems will be perpetuated for future generations is based on popular participation, the dissemination of scientific knowledge, and the experience of these spaces.
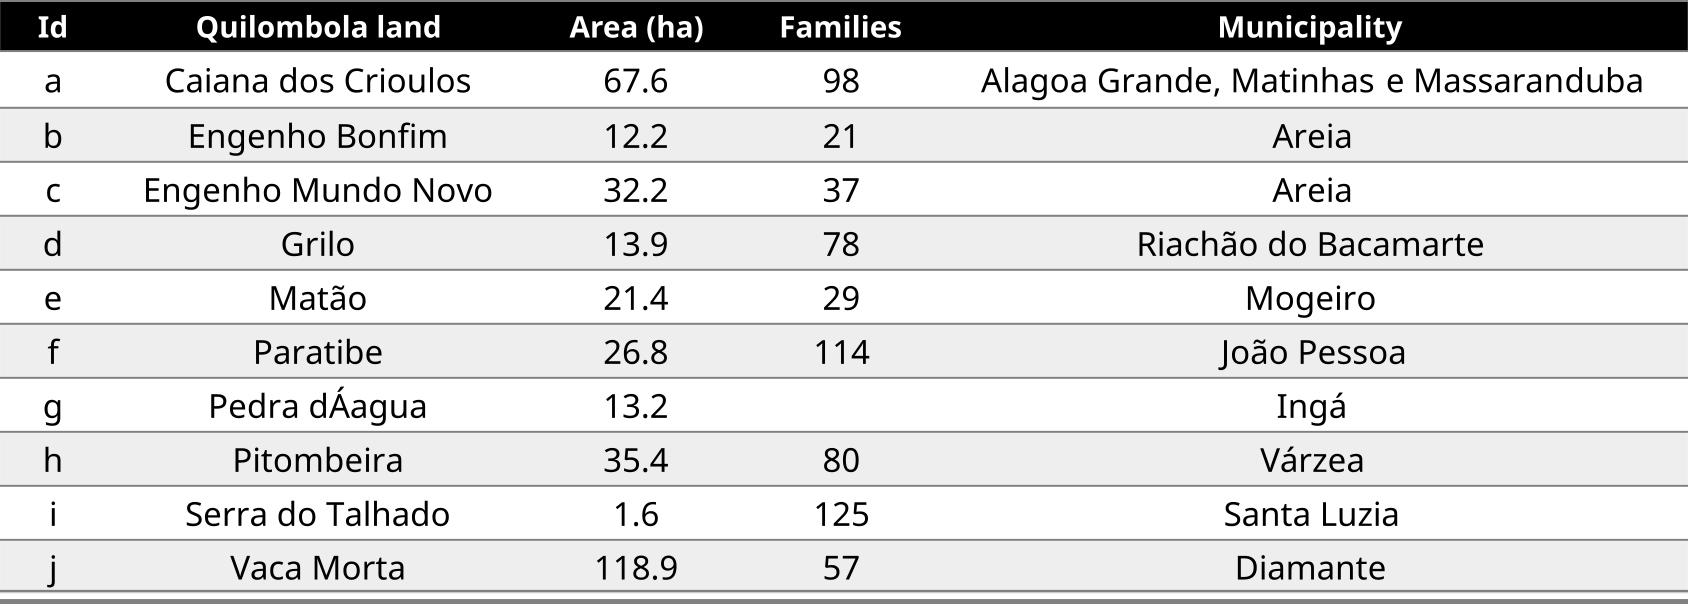
In addition to the Conservation Units, the State of Paraíba has lands designated for Indigenous populations, and Quilombola Communities, either regulated or under regulation, are presented in Figure 1.8 and Tables 1.2 and 1.3.
Table 1.2 - Indigenous lands in the State of Paraíba. The letters (Id) indicate the position on the map.
Source: FUNAI (National Indian Foundation), 2021.

Click on the image to enlarge
Table 1.3 - Quilombola lands in the State of Paraíba. The letters (Id) indicate the position on the map.
Source: Ministry of Agriculture, Livestock and Supply / INCRA (National Institute of Colonization and Agrarian Reform), 2021.
Click on the image to enlarge
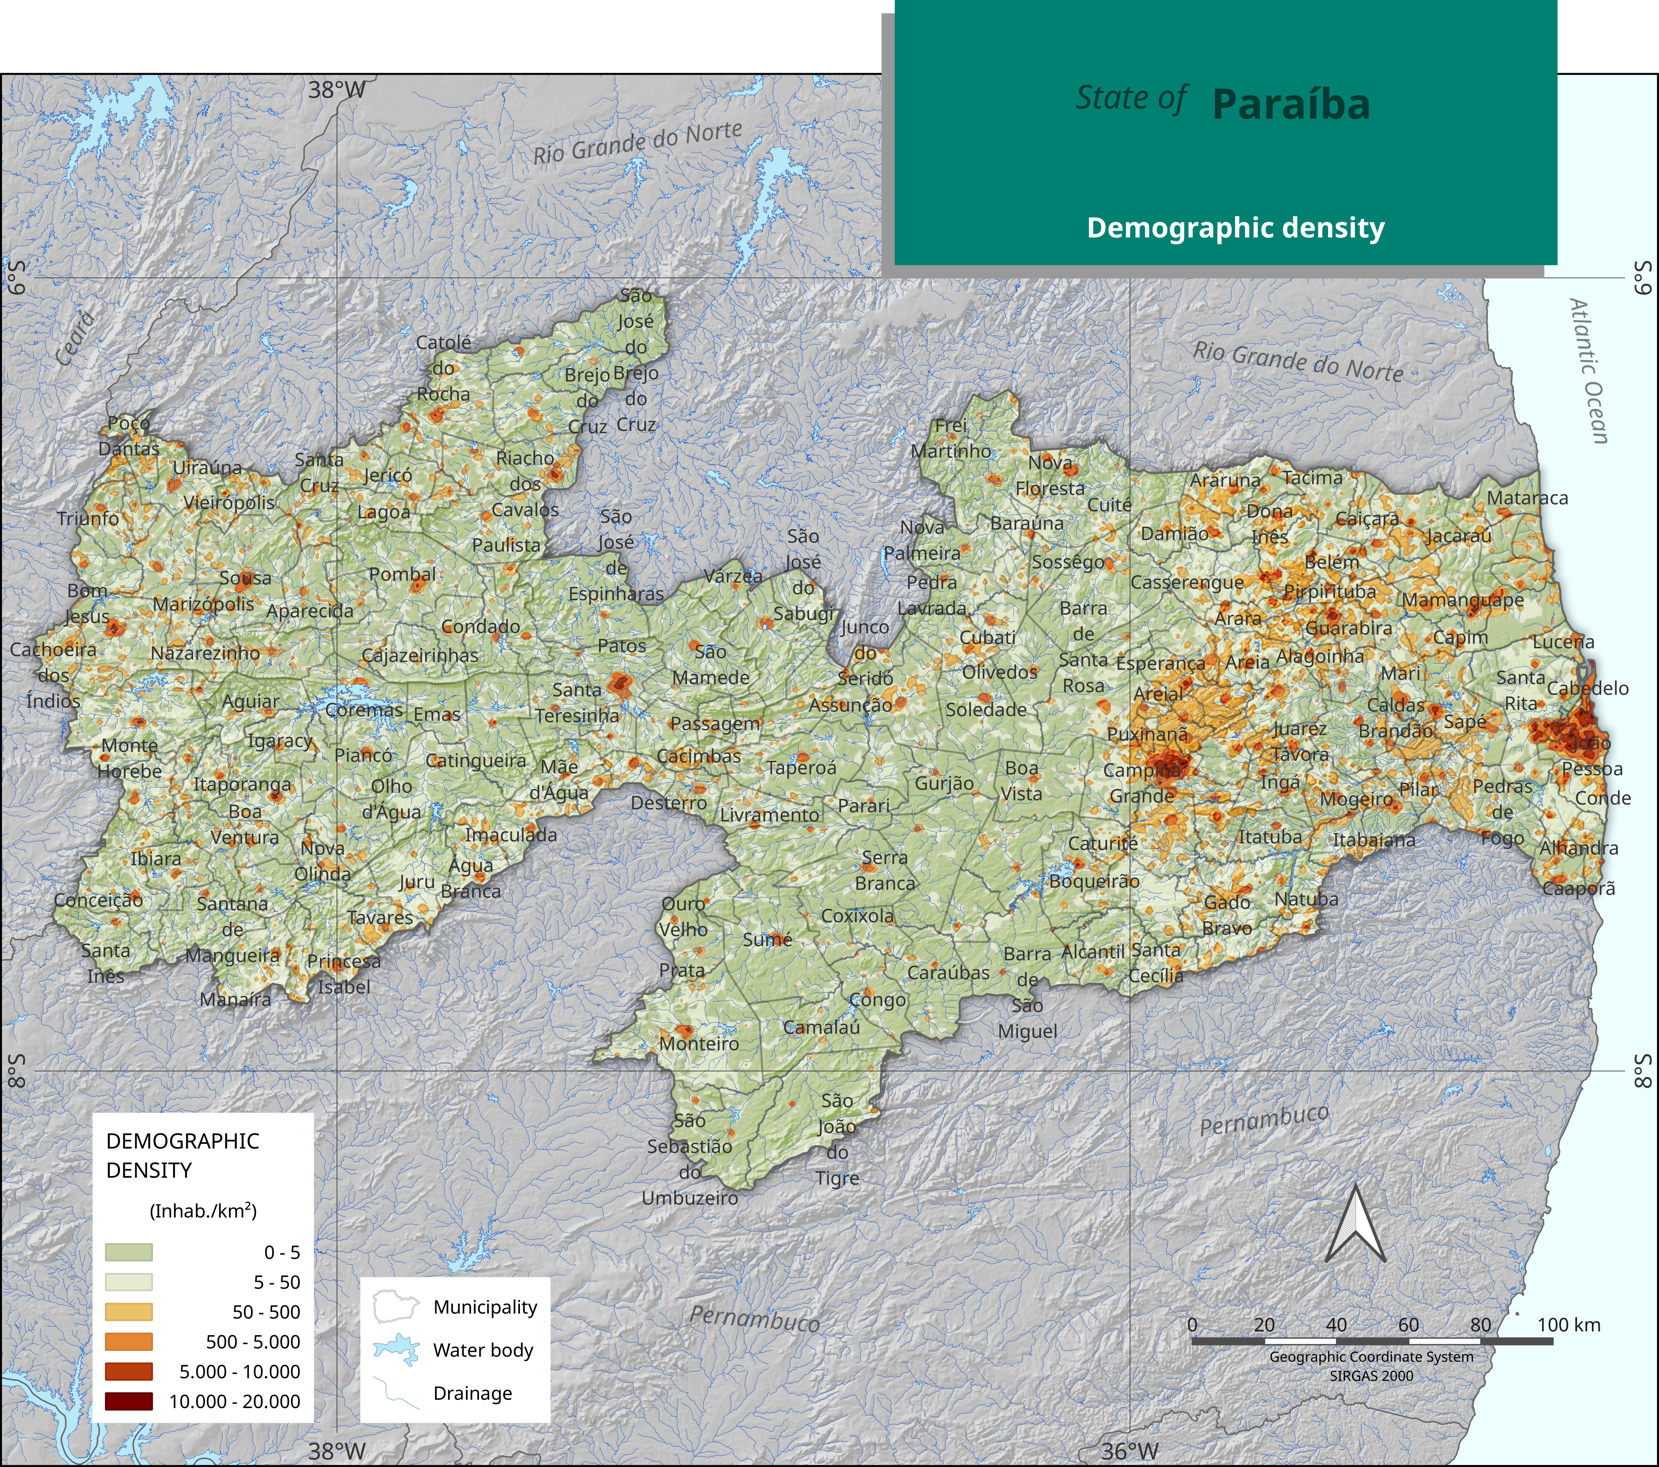
According to the IBGE Demographic Census carried out in 2022, the population of Paraíba was 3,974,495 inhabitants, registering a growth rate of 0.45% p.a. between 2010 and 2022. The state's demographic density is 70.4 inhab./km² (Figure 1.9). Population data by sex and urban/rural residence had not yet been published by the IBGE when this document was printed (July/2023). Updated values can be obtained from the 2022 Census page.
Click on the image to enlarge
Figure 1.9 - Population density map.
Sources: IBGE/Documentation and Information Dissemination Center/Statistics Grid, 2016; IBGE/Base Cartográfica BC250, 2021; IBGE Demographic Census, 2022.
Still considering the 2022 Census, the most populous cities in Paraíba are João Pessoa, the state capital, with about 834 thousand inhabitants; Campina Grande, with approximately 420 thousand inhabitants; Santa Rita, with approximately 150 thousand inhabitants; Patos, with about 105 thousand inhabitants, and Bayeux, with approximately 83 thousand inhabitants.
According to IPEA (2022), the Human Development Index (HDI) of the State of Paraíba has advanced in the last decade, from 0.66 in 2010 to 0.72 in 2017.
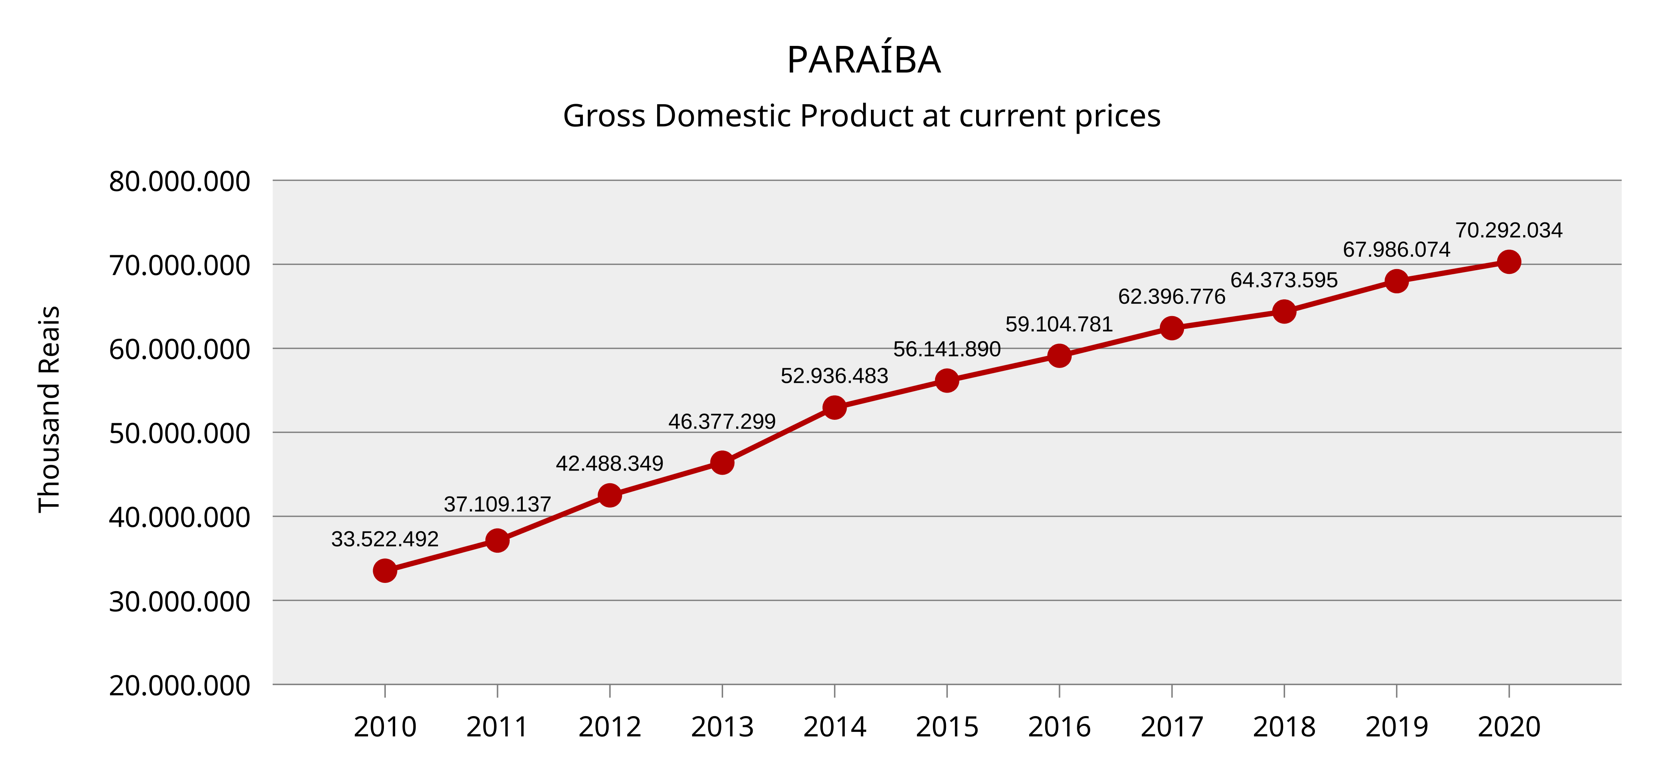
Data from the State Secretary of Planning, Budget, and Management indicate that Paraíba's Gross Domestic Product (GDP) was around R$ 70.3 billion. Figure 1.10 shows the evolution of GDP in Paraíba over the last two decades, with a growth of around 2.1 times between 2010 and 2020.
Click on the image to enlarge
Figure 1.10 - Evolution of the Gross Domestic Product of the State of Paraíba.
Source: IBGE, in partnership with the State Statistical Agencies, State Government Secretariats, and the Manaus Free Trade Zone Superintendence - SUFRAMA.
The economy of Paraíba is based on agricultural production, the leather industry, and tourism. The main agricultural products are sugar cane, pineapple, cassava, corn, beans, and herbaceous cotton (IBGE, 2022). The state has an estimated herd of 1.3 million head of cattle, raising pigs, sheep, and horses. In addition to leather goods, food, and textile products, sugar and alcohol are also industrialized.
According to ANEEL's Generation Information System (SIGA), Brazil's installed electricity generation capacity (supervised power) is around 189,871 MW, with photovoltaic solar responsible for 4.1% of centralized generation. Nevertheless, when considering the already existing potential in distributed generation (DG – 17,000 MW), the installed capacity in Brazil (centralized + DG) is 206,871 MW, with photovoltaic solar responsible for 11.8% of this total, which places it as the second largest renewable source in the country behind only the water source (ANEEL/SIGA, 2023; ANEEL/Distributed Generation, 2023).
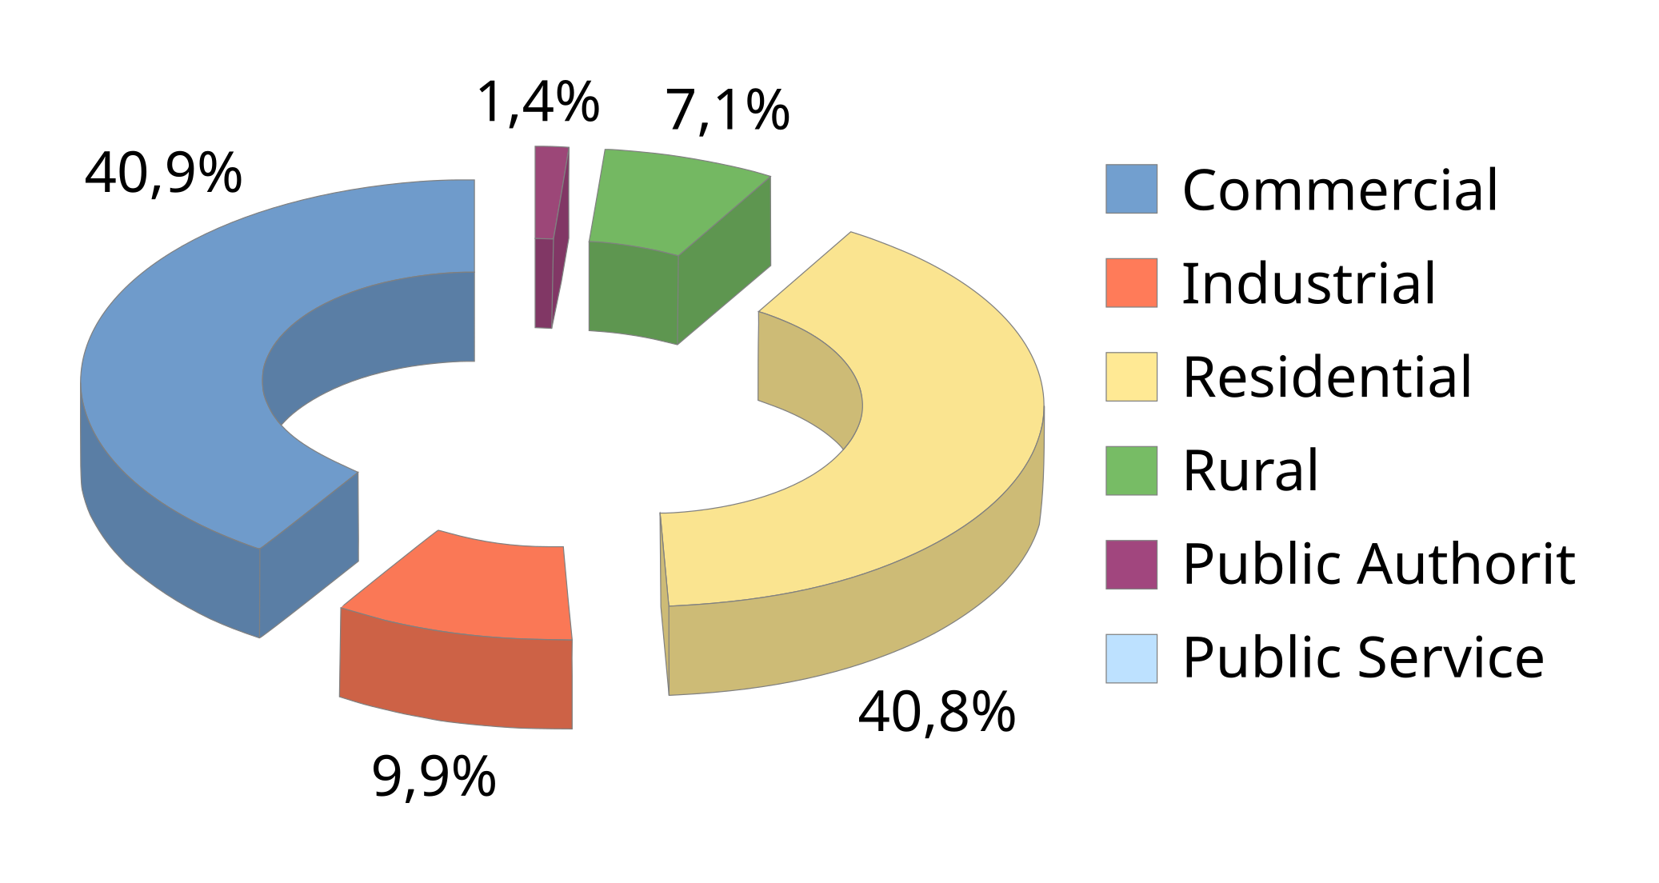
The share of photovoltaic solar energy stands out even more in Paraíba. The total installed electricity generation capacity is 1,733 MW (corresponding to 0.9% of the centralized power generation in Brazil), with photovoltaic solar responsible for 26.2% (454 MW). The total installed capacity in distributed power generation (supervised power) reaches 1,992 MW, with solar photovoltaics responsible for 35.7%. These numbers place PV technology as the primary energy source in Paraíba. (ANEEL/SIGA, 2023; ANEEL/Distributed Generation, 2023). For the distributed power generation, the photovoltaic systems are concentrated mainly in the commercial and residential classes, with 40.9% and 40.8%, respectively, as shown in Figure 1.11.
Click on the image to enlarge
Figure 1.11 - Percentage of participation by consumption class of photovoltaic solar source in distributed power generation (DG).
Source: Adapted from ANEEL/Distributed Generation, 2023.
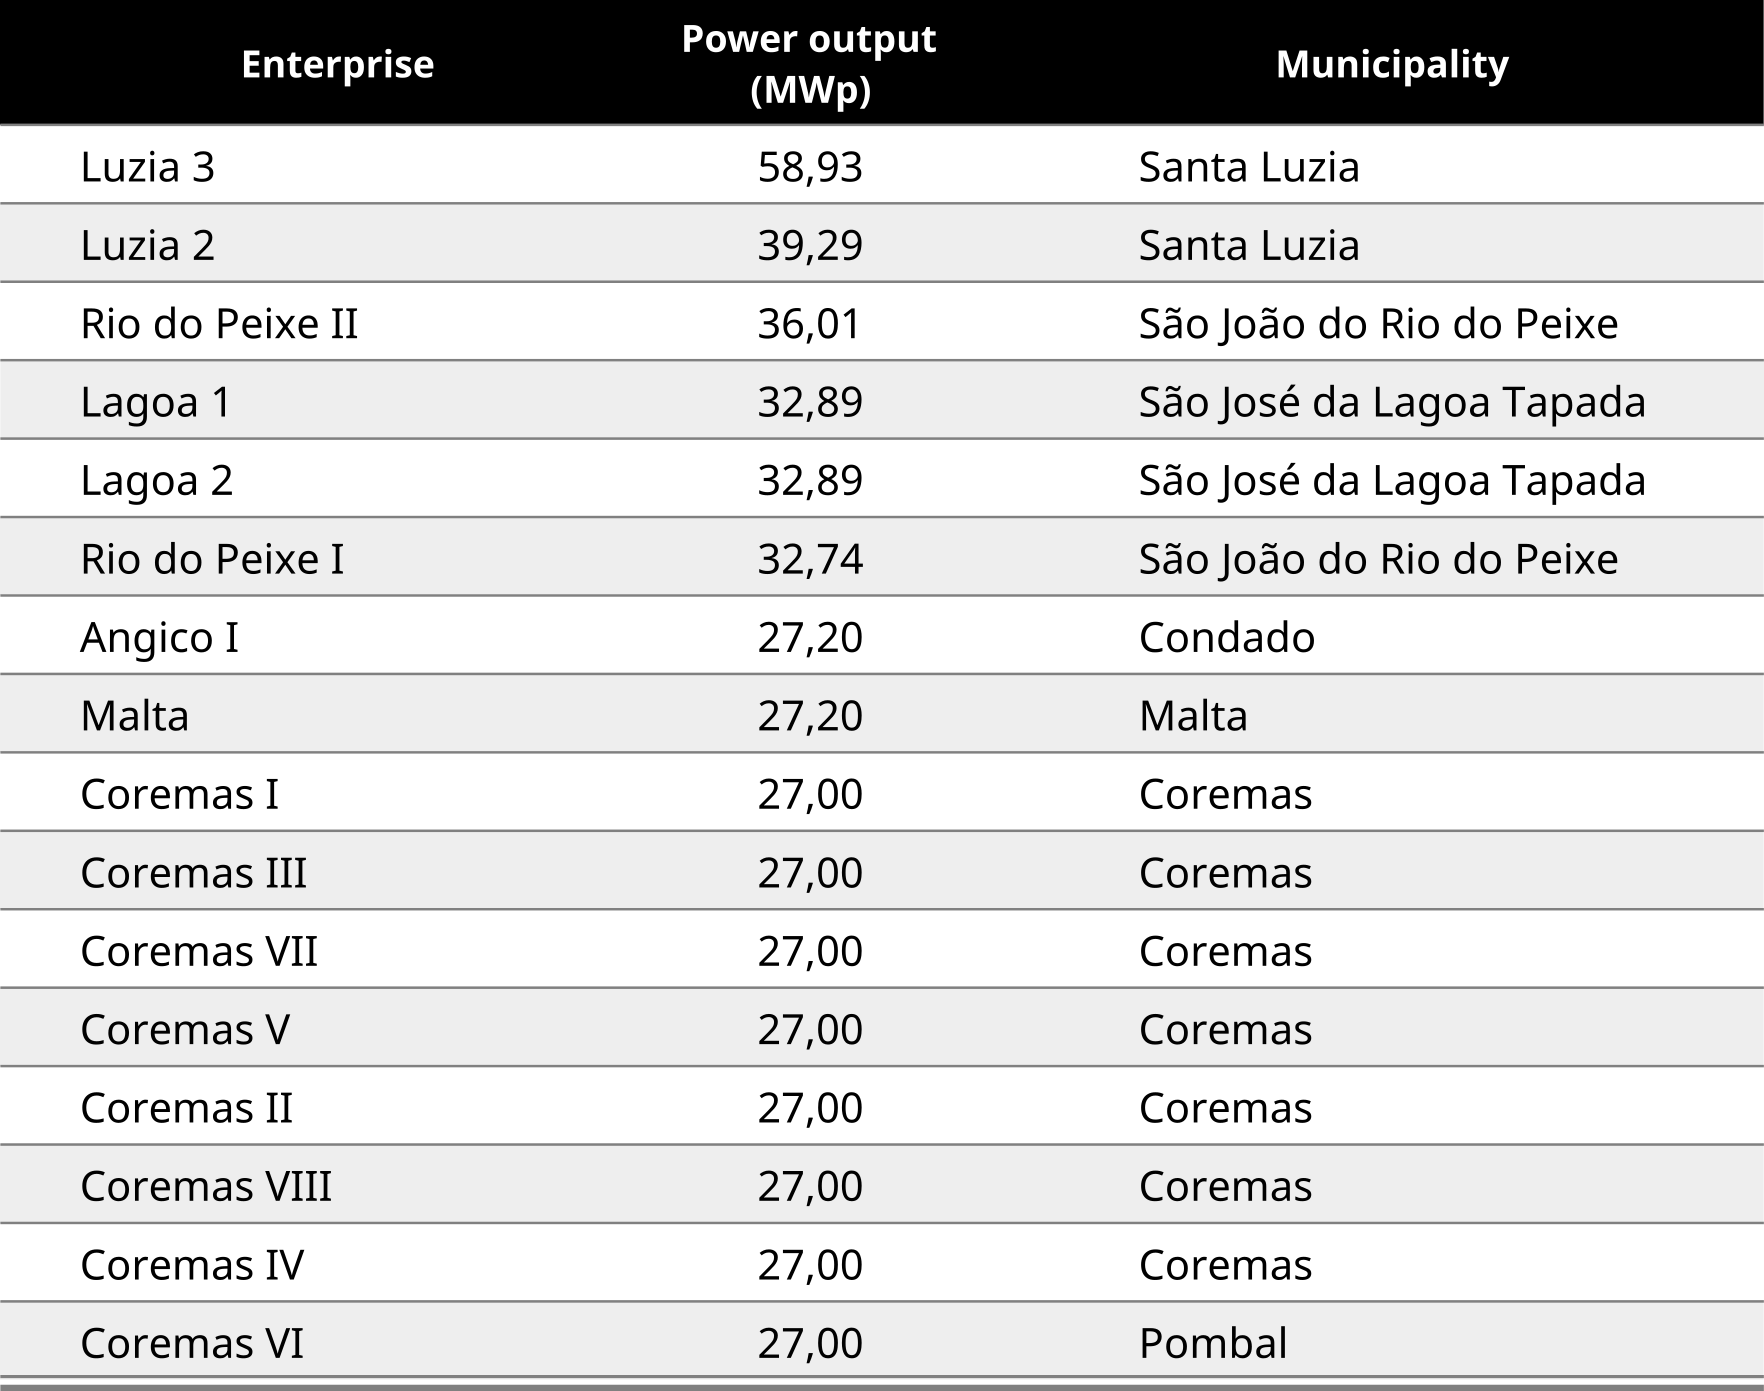
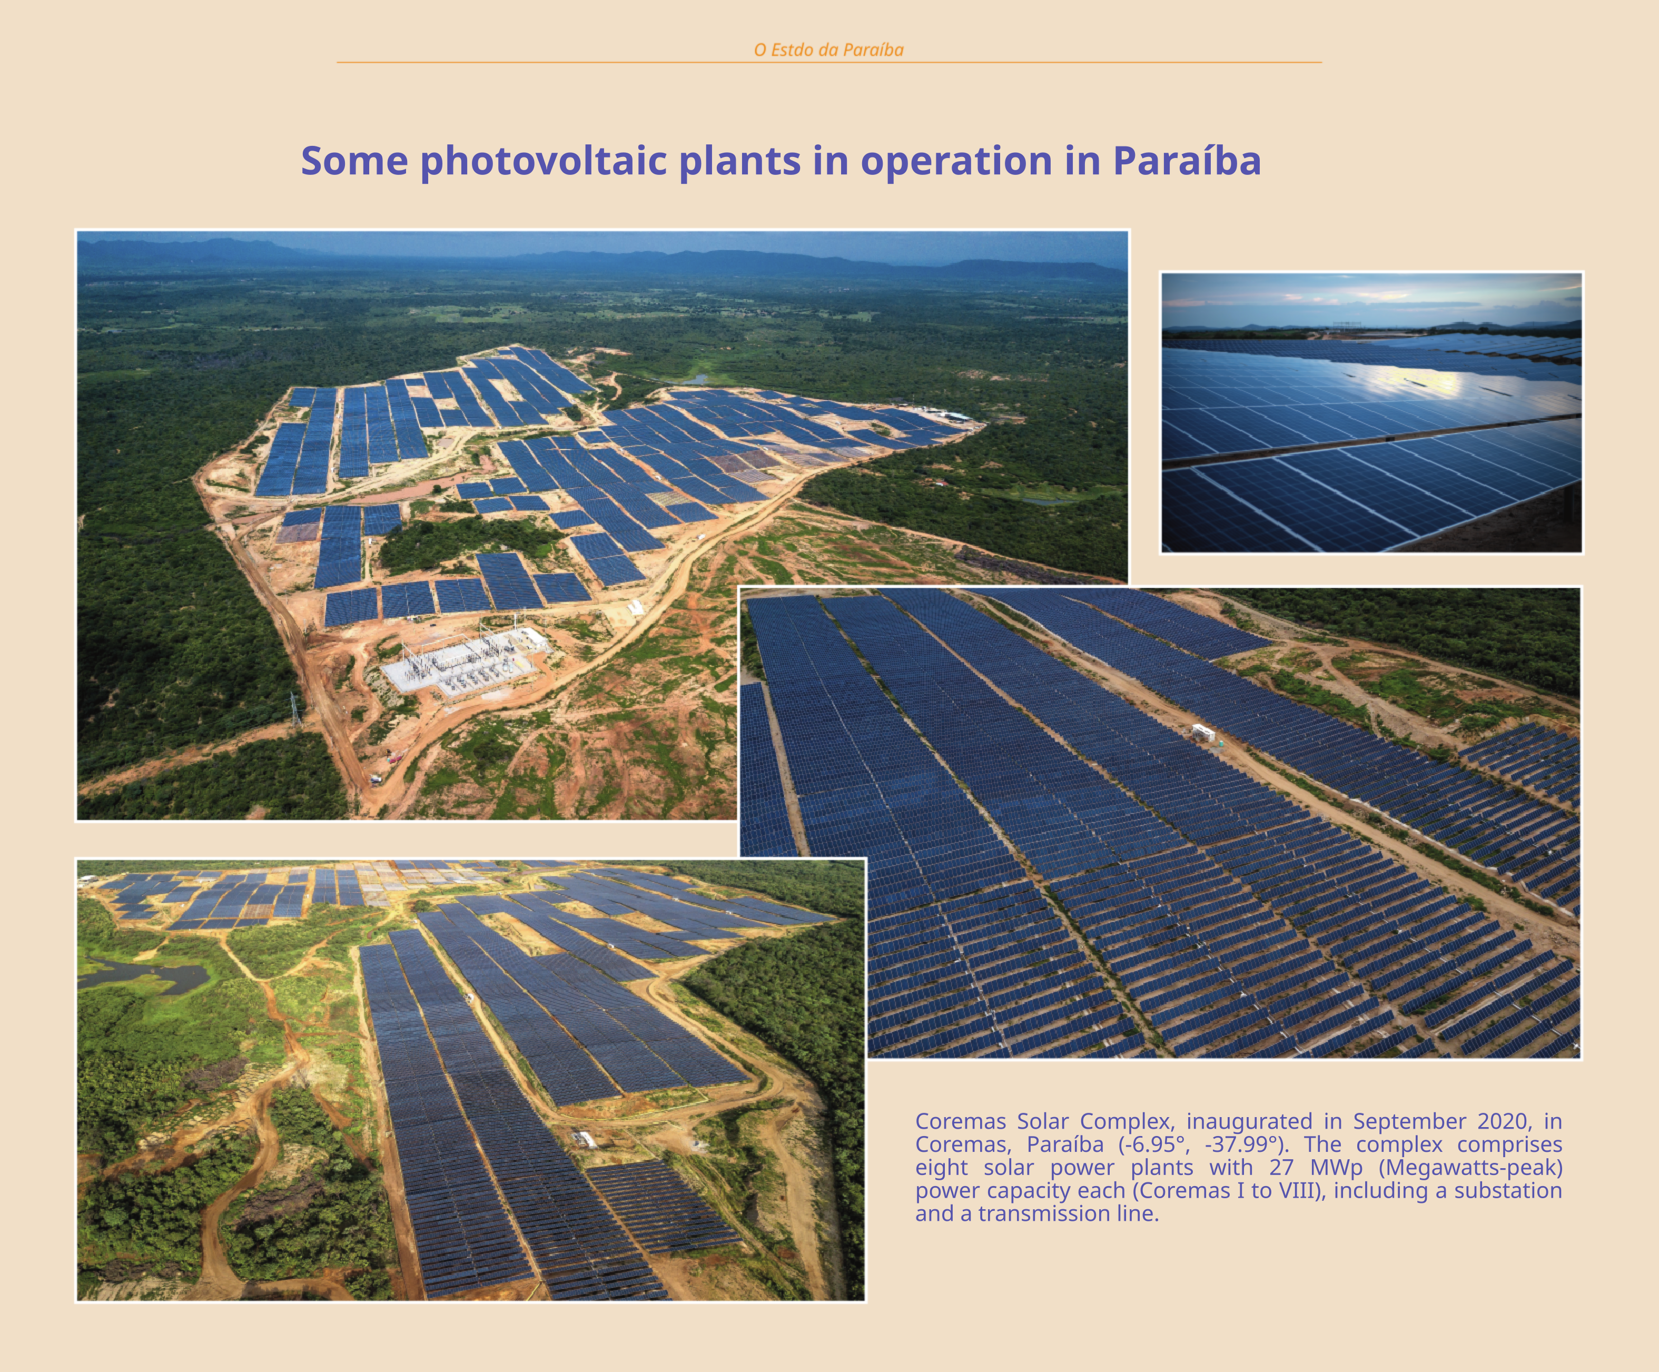
Table 1.4 lists the top photovoltaic power plants operating in Paraíba – centralized generation (ANEEL/SIGA, 2023).
Table 1.4 - Top photovoltaic power plants operating in Paraíba – centralized generation.
Source: ANEEL/SIGA, 2023.
Click on the image to enlarge
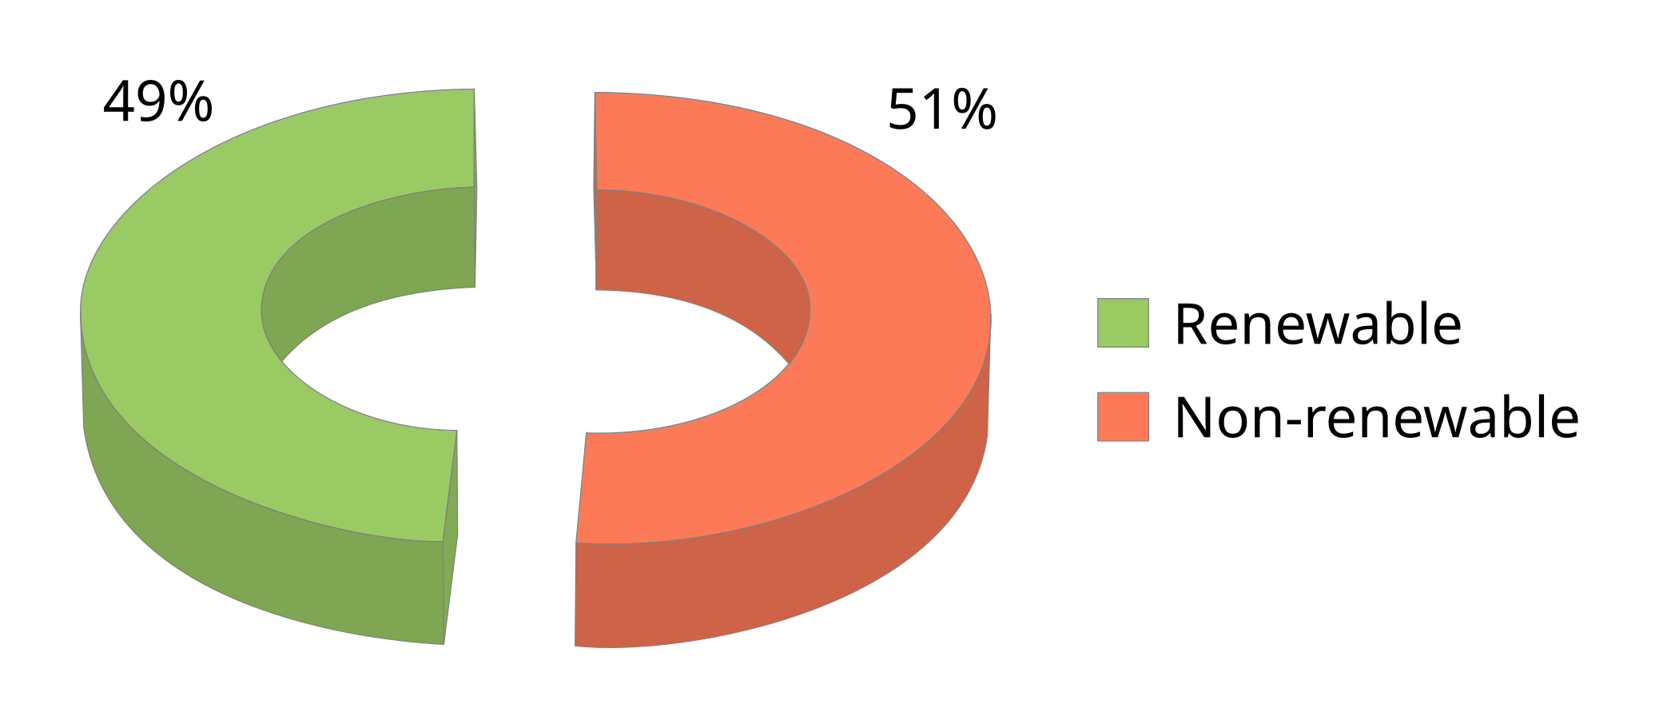
According to the National Energy Balance (BEN, 2022), Paraíba generated approximately 3,434 GWh in 2021, equivalent to 2.3% of the total produced in the Northeast region and 0.5% in Brazil. Renewable energy sources account for approximately 1680 Gwh (49%) of Paraíba's electricity mix. Thermoelectric power plants participate with 1750 Gwh (51%), as shown in Figure 1.12. The residential sector alone was responsible for the consumption of 2,346 GWh, or 68% of the total generated in the state.
Click on the image to enlarge
Figure 1.12 - Share of renewable energy resources in the Paraíba's electricity mix of Paraíba.
Adapted from ANEEL/BEN, 2022
Paraíba can assume a more significant role in power generation, considering the available potential of solar and wind energy resources.
Regarding the potential for photovoltaic solar generation, previous studies show that Paraíba is within the solar belt (Pereira et al., 2017) with high solar radiation at the surface. This Atlas details the spatial and temporal distribution of downward surface solar radiation in Paraíba, demonstrating that the state has enormous potential for growth in the solar energy market.
The Wind Atlas of the State of Paraíba indicates that more than 90% of the areas presenting annual mean wind speed higher than 7.0 m/s at 150 meters high are less than 40 km away from one of the substations.
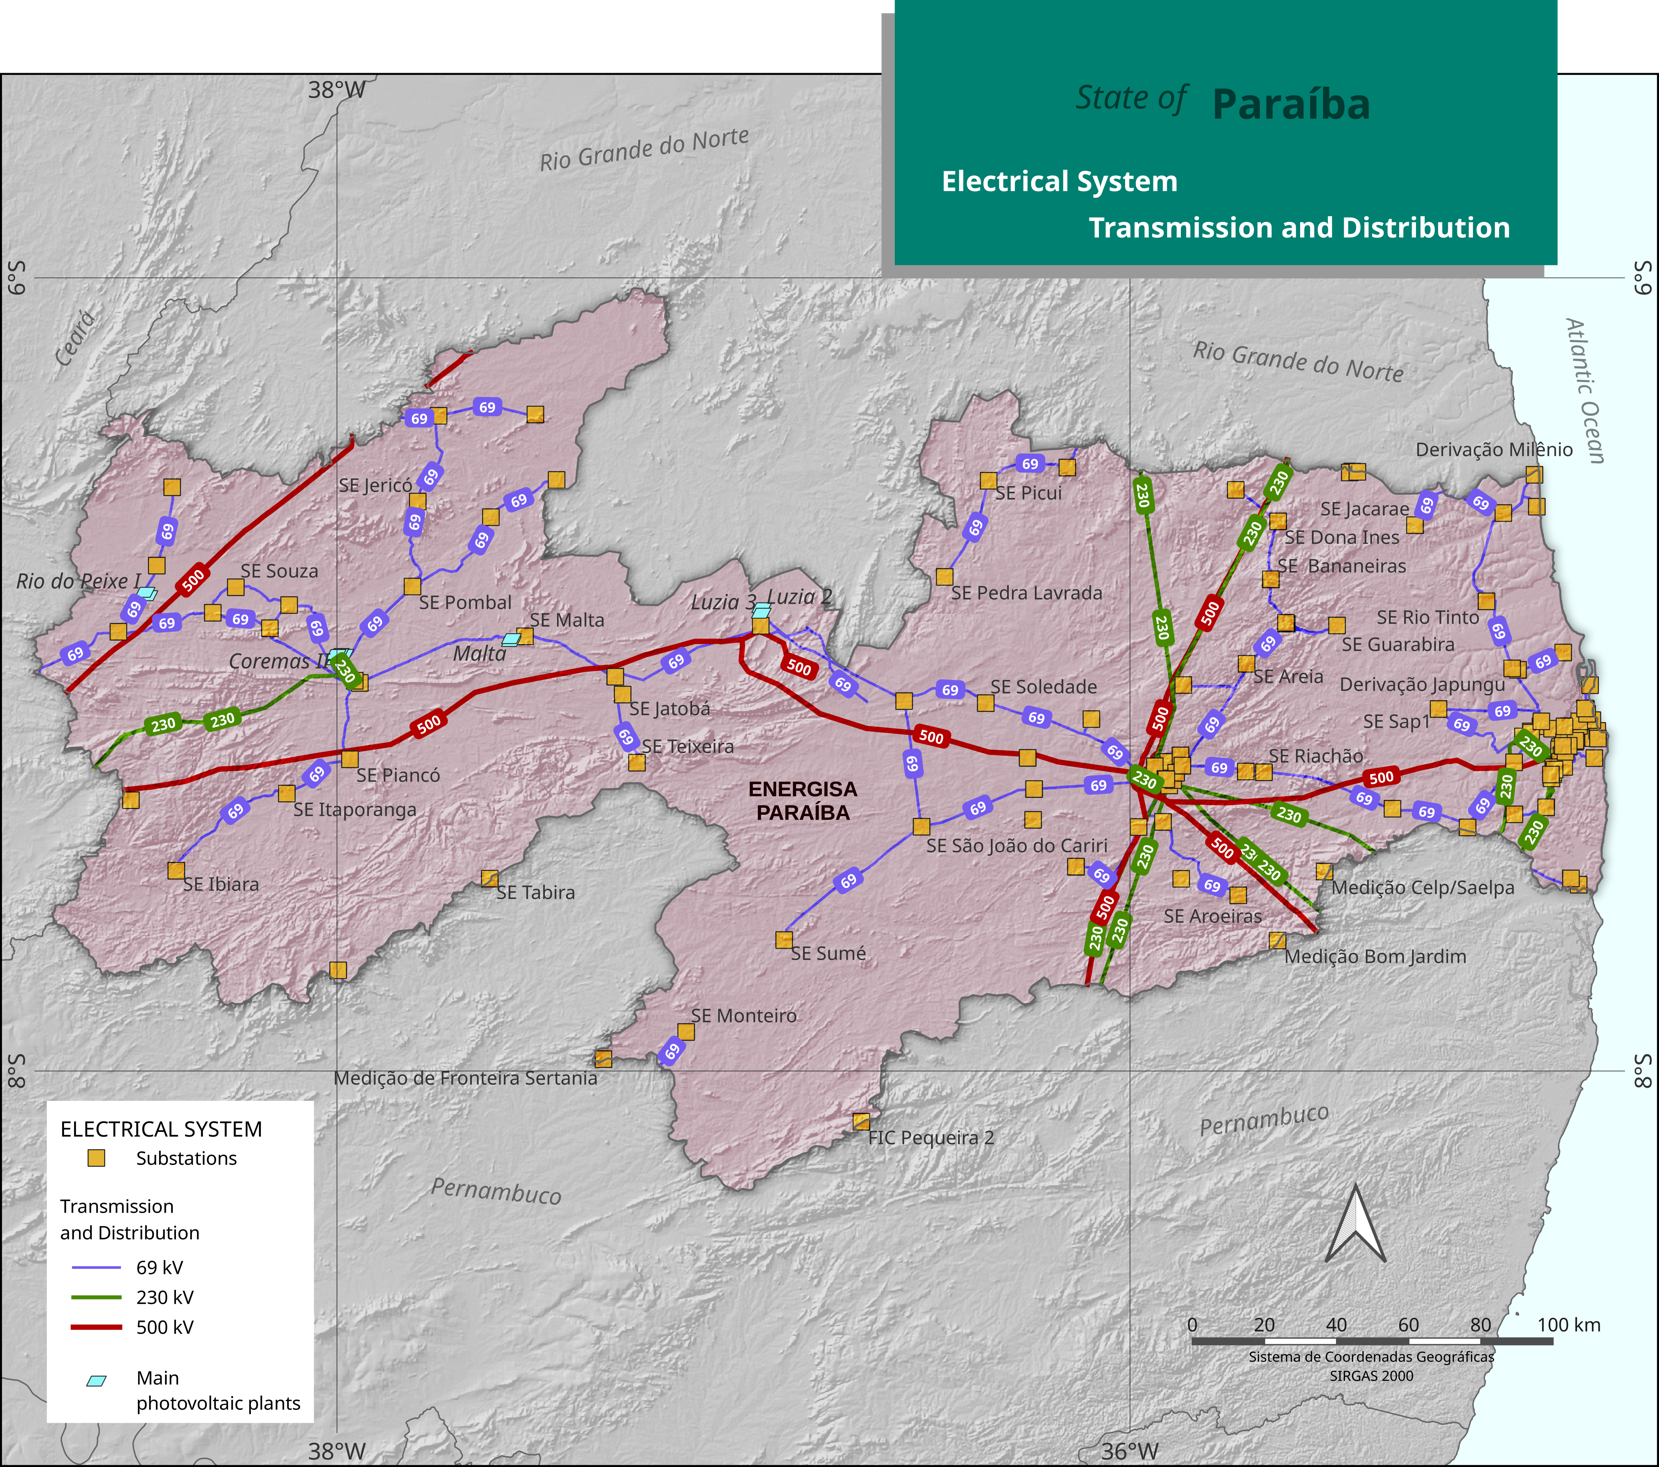
Information on the electrical system serving the state of Paraíba was provided by the National Electric Energy Agency (ANEEL) and the Energy Research Company (EPE). It was used to prepare the scenarios for using the solar resource presented later in this document.
According to ANEEL and EPE, the transmission system in Paraíba consists of 500 kV and 230 kV lines, as illustrated in Figure 1.13.
According to the Distribution Company's Geographical Database (BDGD), the distribution system under ANEEL's responsibility is primarily made up of 69 kV lines currently operated under concession by Energisa Paraíba, which serves the entire state, as also shown in Figure 1.13.
Click on the image to enlarge
Figure 1.13 - Electric system in Paraíba, including transmission and distribution lines and power plant locations.
Source: ANEEL (2022) and EPE (2023).
Click on the image to enlarge