
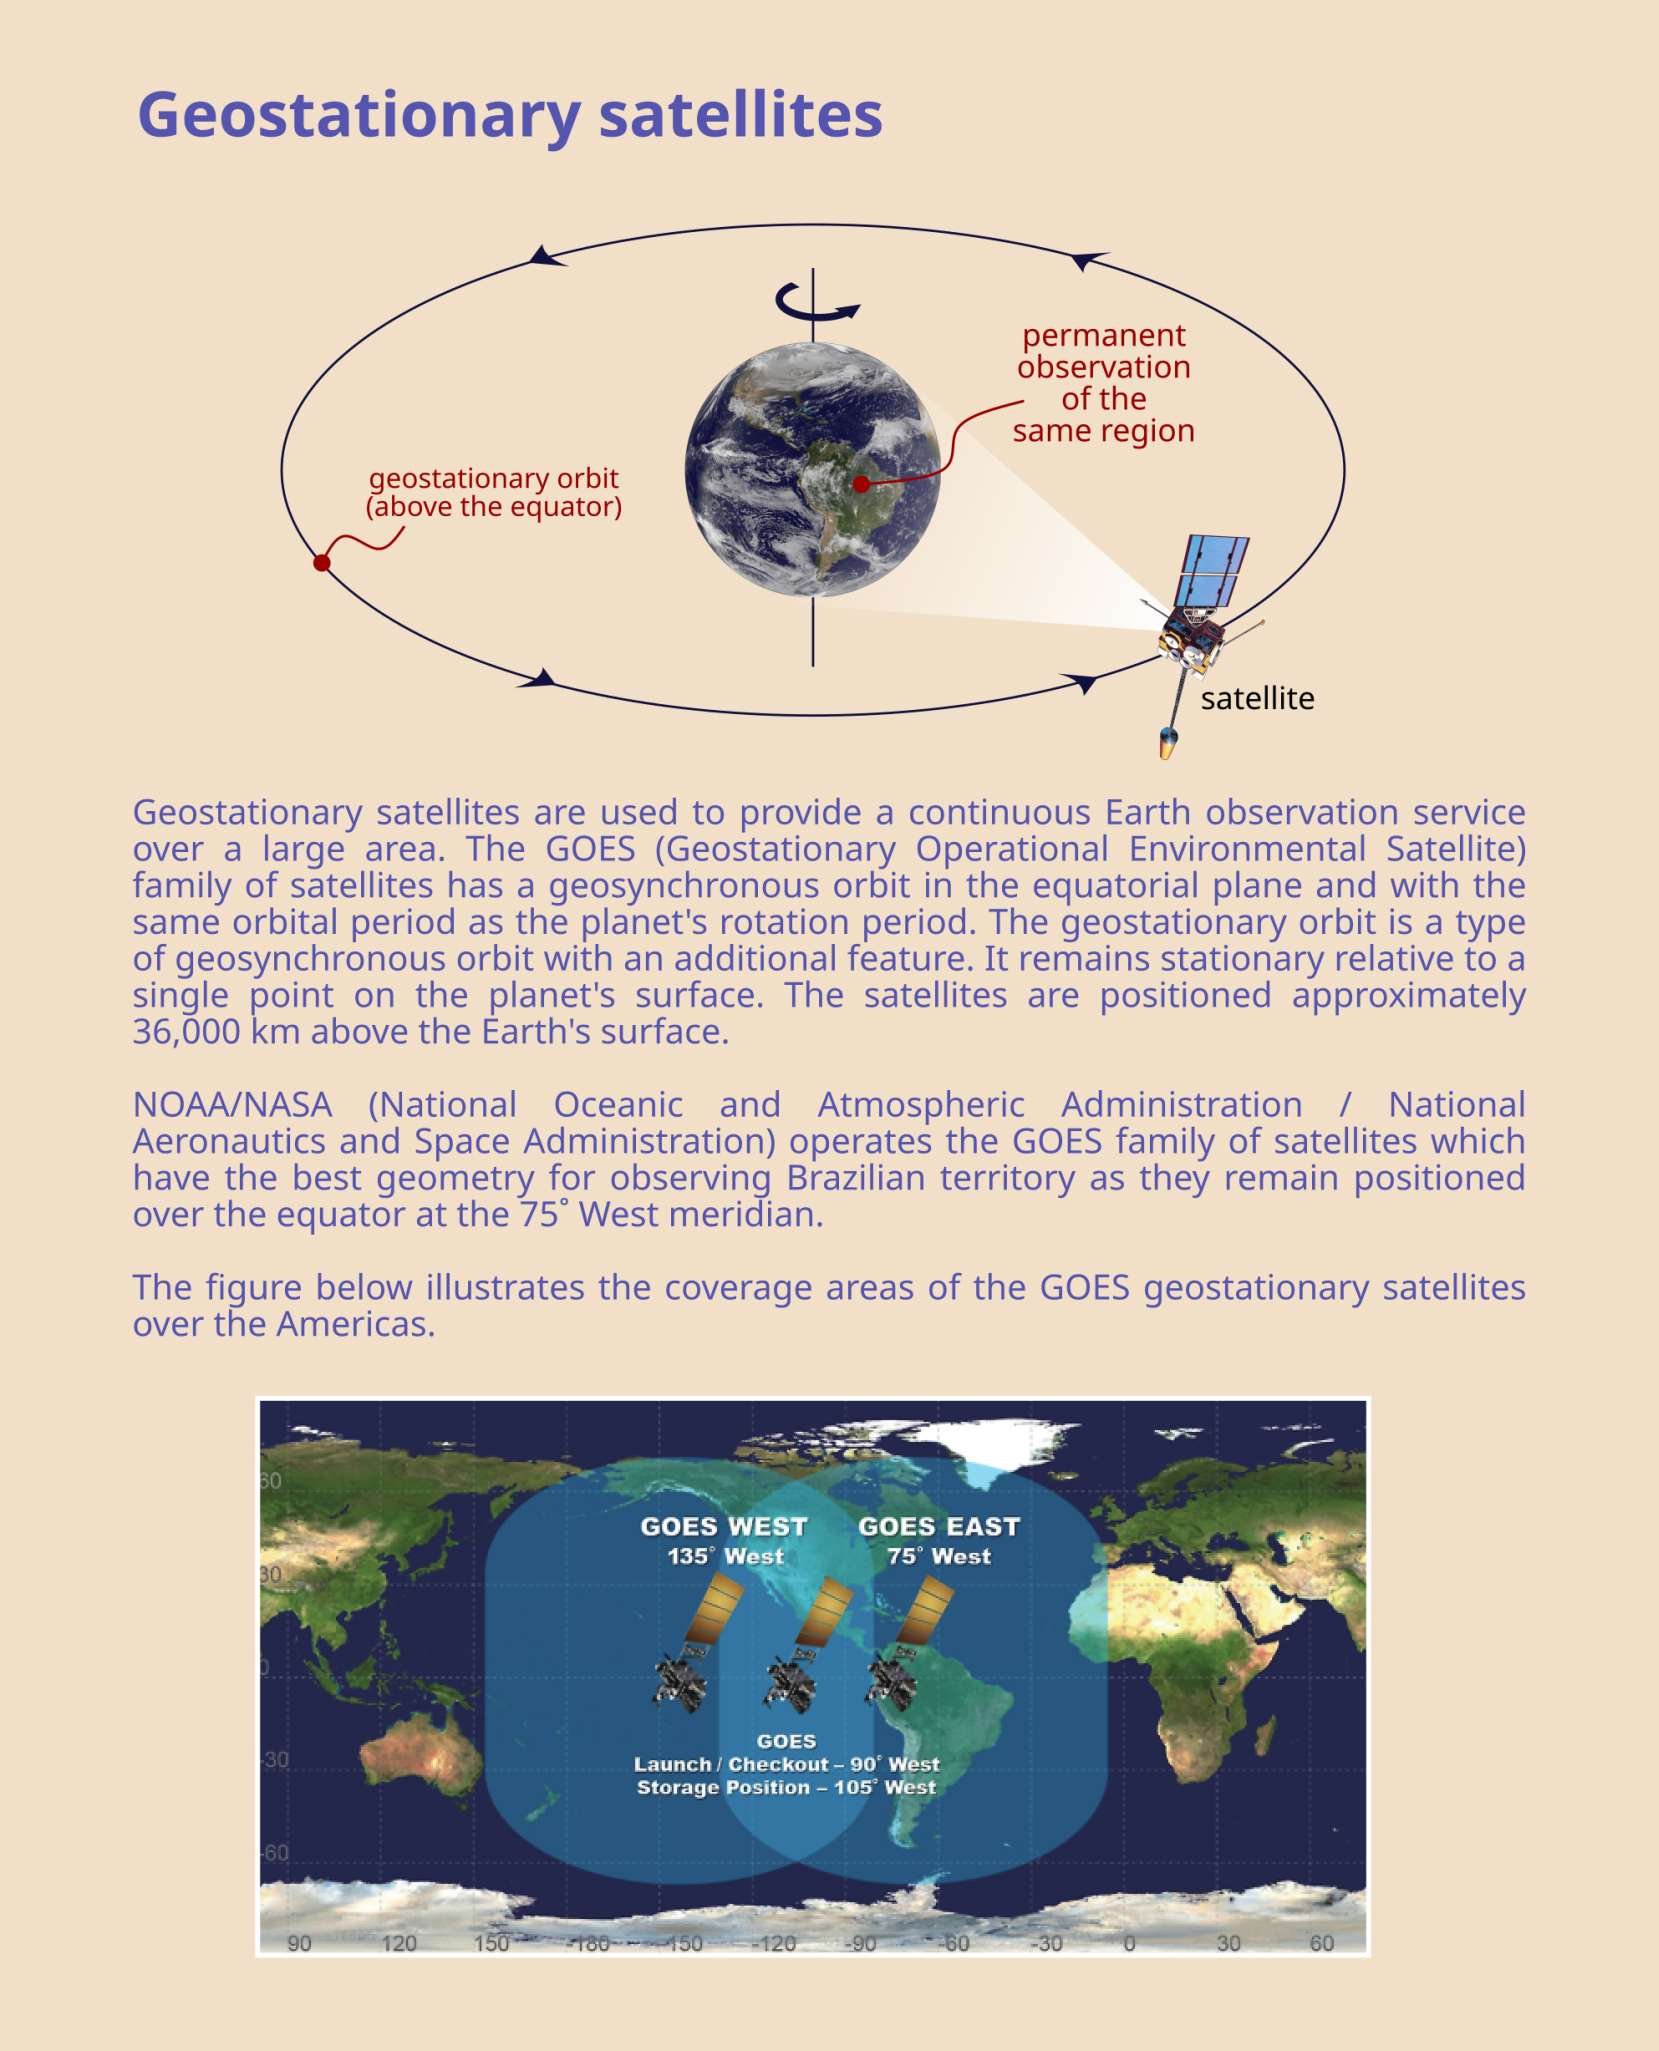
The elaboration of the Solarimetric Atlas of Paraíba adopted an innovative methodology that combines the use of a radiative transfer numerical model, reanalysis database, and data observed by remote sensing of the atmosphere (Martins & Pereira, 2006; Martins et al., 2008; Costa et al., 2016; Pereira et al., 2017). As a result of research carried out over the last few decades, the spectral model of radiative transfer in the atmosphere, BRASIL-SR, used in the elaboration of this Atlas, employs physical properties of the atmosphere - air temperature, relative humidity, optical thickness of aerosols, concentration of atmospheric gases, cloudiness – to estimate the vertical profile of the leading gases and particles present in the atmosphere based on consolidated techniques in the scientific literature. Data related to land cover and use (albedo and altitude) are also essential for simulating the physical processes of attenuation and scattering of solar radiation and obtaining solar irradiance incident on the surface and reflected back to the sky (Casagrande et al., 2021). Information on atmospheric cloudiness, the main factor modulating the downward solar radiation on the surface, is obtained from images from geostationary satellites in the GOES family.
Click on the image to enlarge
The values of incident solar irradiance on the surface provided by the BRASIL-SR model for each satellite image are numerically integrated to determine the daily totals for a period of 10 years starting in 2012. The uncertainties associated with the methodology are assessed using statistical metrics, such as bias or systematic deviations, the root-mean-square error, and Pearson's correlation, determined by comparing the estimated and observed values at the surface measuring stations.
The database made available in this Atlas includes the annual and monthly averages of the daily total of the following components of surface solar irradiation:
The solar irradiation values produced by the BRASIL-SR model have been adopted as a reference for the Brazilian territory by government institutions and energy sector entrepreneurs (CRESESB, 2022; SOLERGO, 2022).
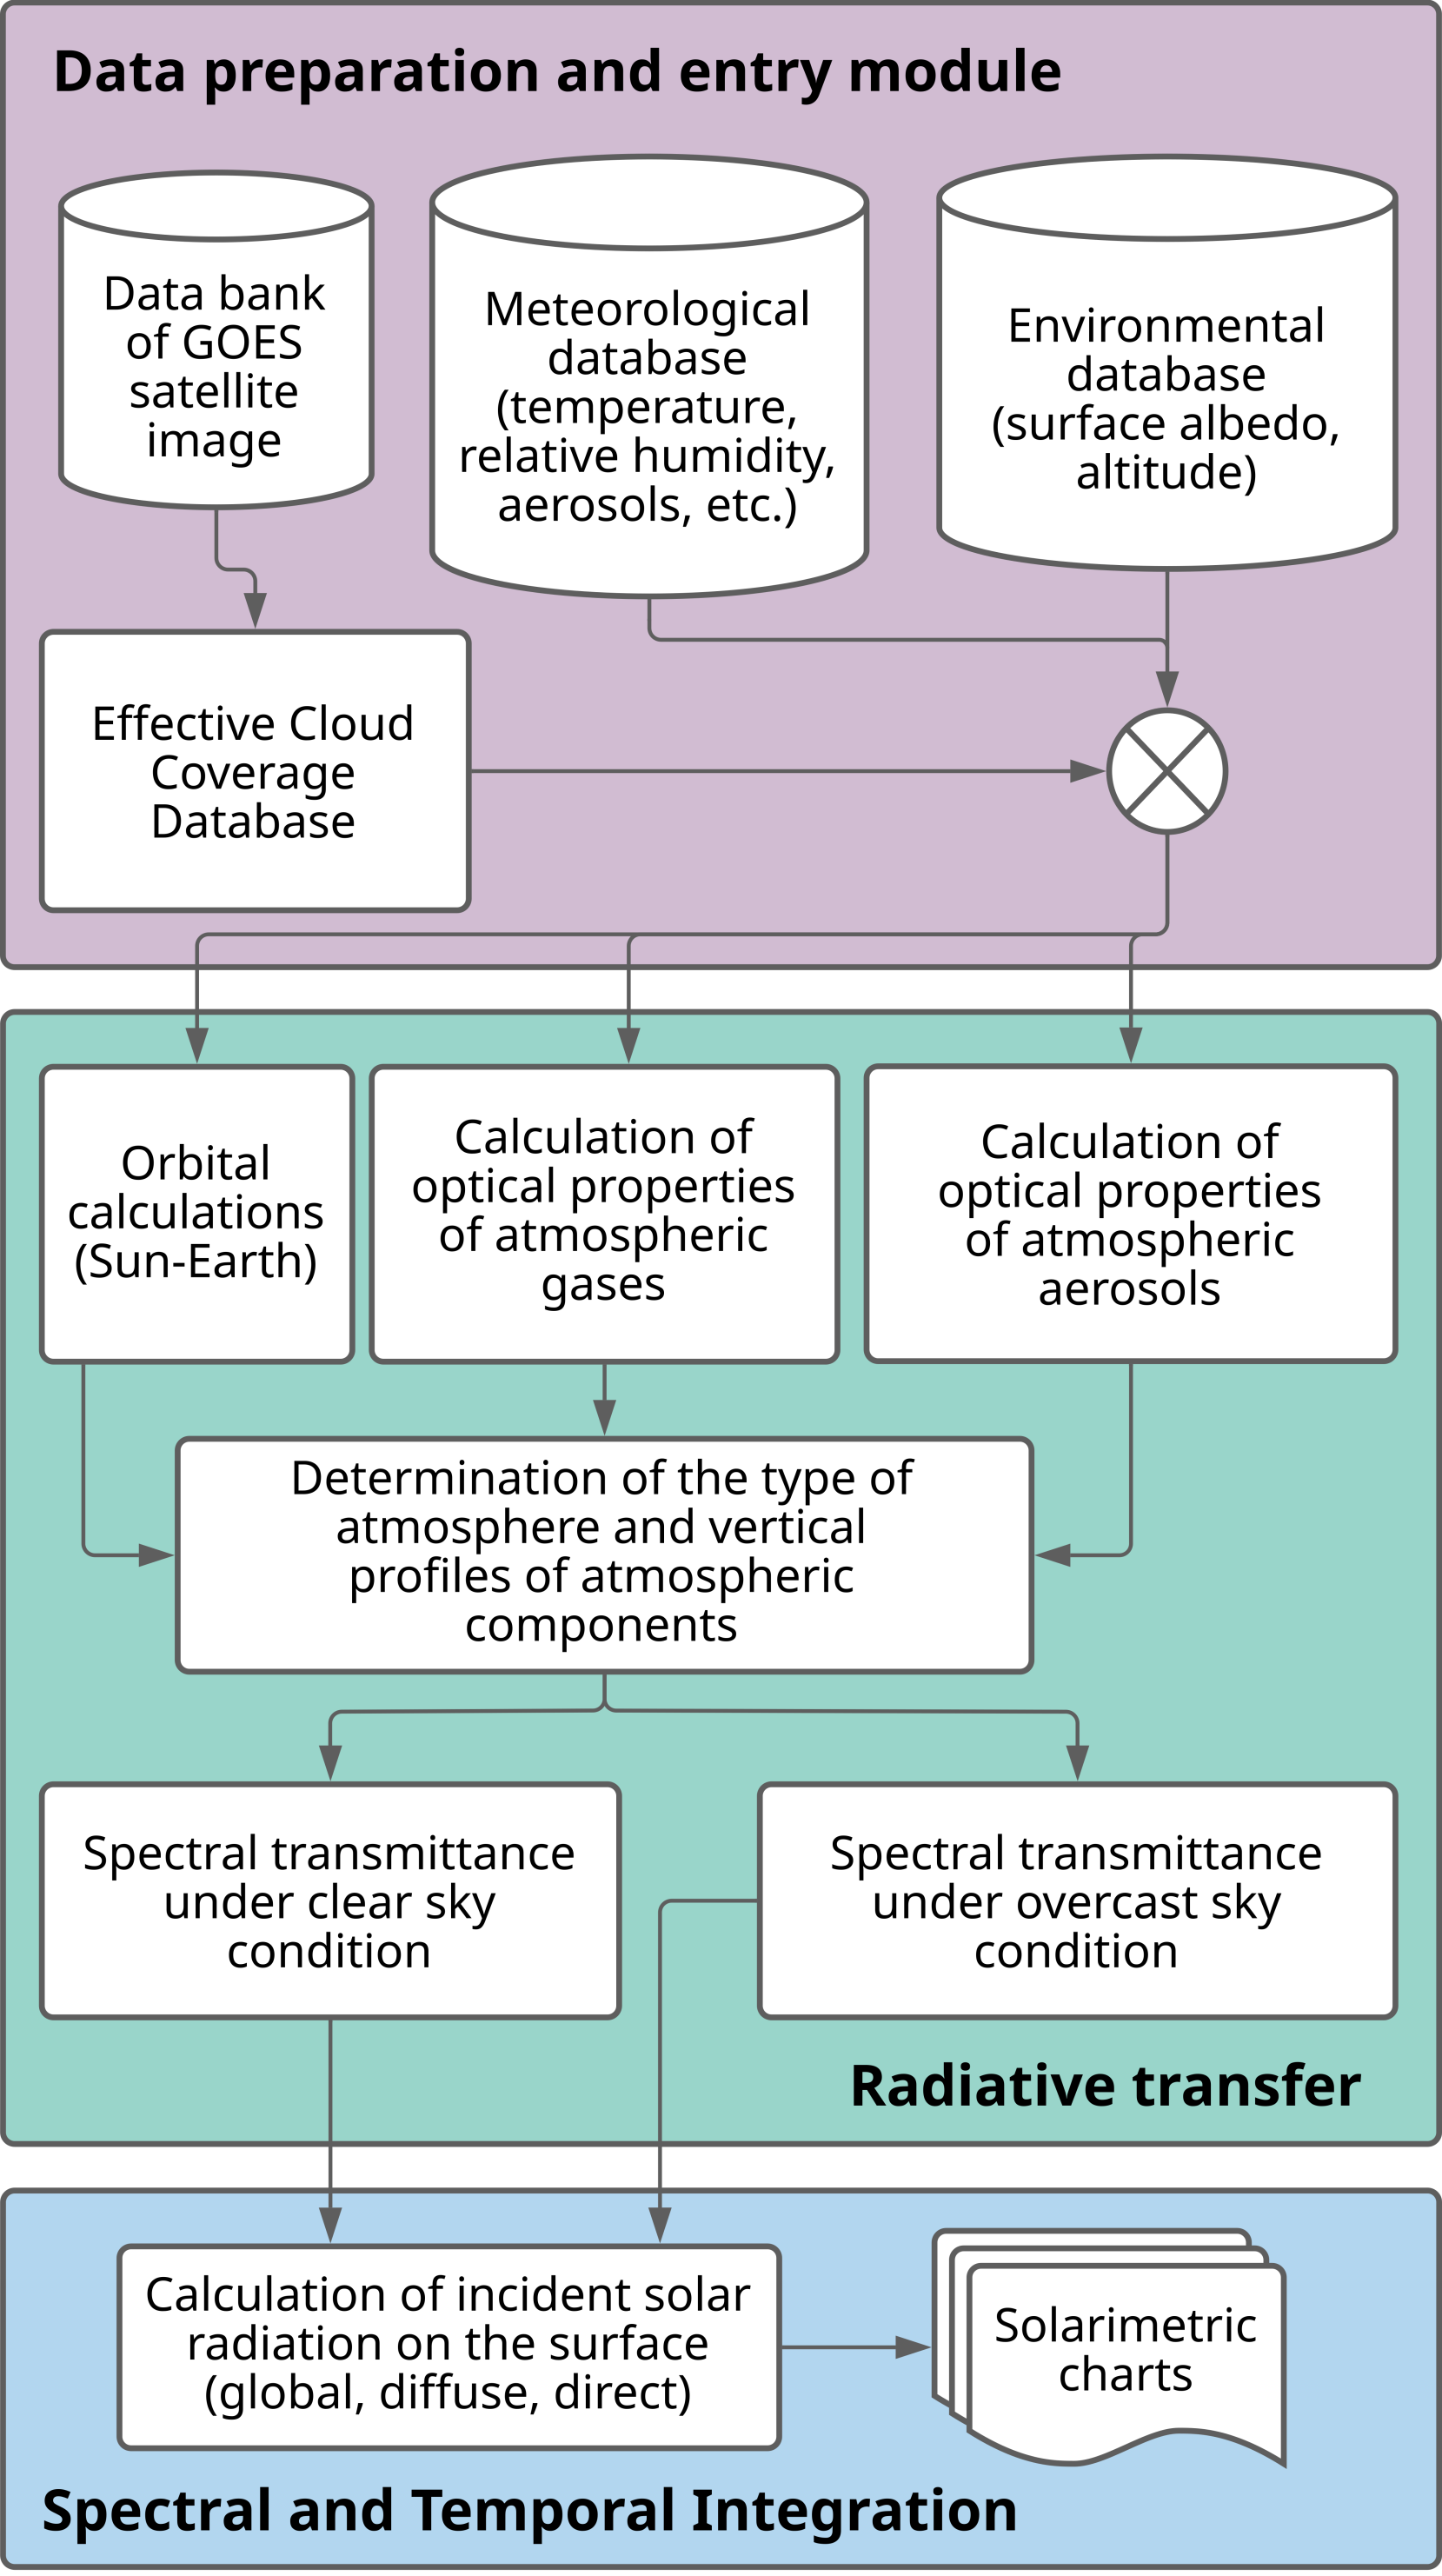
Figure 3.1 presents the model operation flow. The BRASIL-SR spectral model uses 37 spectral intervals distributed between 200 nm to 3700 nm. Solar spectral data at the top of the atmosphere (TOA) follow Gueymard (2004).
Click on the image to enlarge
Figure 3.1 - Block diagram of the methodology used in the Solar Atlas of Paraíba.
The vertical profiles of air temperature, atmospheric pressure, and atmospheric gas concentration follow Anderson et al. (1986), and they are available for five standard atmospheres selected based on the surface temperature. The absorption coefficients of solar radiation by water vapor, O₃, CO₂, and O₂ gases are calculated based on methods proposed by Wiscombe (1977), Schreier (2019), and Gordon (2017).
The model surface boundary condition is established based on the surface spectral albedo for direct and diffuse radiation. Albedo information was determined as described by Schaaf et al. (2002) using the derived BRDF kernel parameters for the MODIS sensor on the ACQUA and TERRA satellites. BRDF kernel parameters are linearly interpolated for the 37 spectral wavelengths used by the model.
The optical depth database of atmospheric aerosols for the 550 nm wavelength is interpolated for the remaining 36 wavelengths of spectral ranges using the Angström exponent as an input parameter (Casagrande et al., 2021). The optical depth of aerosols is distributed vertically in each grid cell, assuming a fixed optical depth of 0.0216 for heights between 5 km and 50 km. Below 5 km height, an exponential decay of the optical depth with altitude is assumed. The selection of the other aerosol optical properties (single scattering albedo and asymmetry factor) is based on the predominant biome in each grid cell, as described in Darbyshire et al. (2018).
The BRASIL-SR model assumes that the clouds are distributed in two atmospheric layers of the vertical profile of the atmosphere. The optical properties of Stratocumulus clouds were used for the Atlas. The methodology assumes that under a completely overcast sky, there is no incidence of direct irradiation on the surface.
To properly utilize the BRASIL-SR radiative transfer model, one must gather a collection of meteorological and environmental data to numerically parameterize the radiative interactive processes in the atmosphere. This topic provides a brief overview of the necessary steps for organizing this data, which will automate the input data reading process and enable the model to run smoothly. This procedure resulted in the ten years of surface incident solar irradiation data that comprise this Solar Energy Atlas of the State of Paraíba. All the databases used were obtained from renowned institutions and are widely used in various areas, including agribusiness and energy (Casagrande et al., 2021).
Cloudiness is the main factor in attenuating the solar radiation incident on the surface. Therefore, providing the BRASIL-SR model with quality information on the cloudiness present in a given location is essential for obtaining reliable and representative estimates of solar irradiation (estimates with low uncertainty). Quality data on cloud cover over large areas is obtained by analyzing satellite images in the visible spectral range taken by geostationary satellites. The equation determines the effective dimensionless cloud cover index (Ceff) for each pixel (digital image element)

where L represents the radiance value observed by the satellite for a specific pixel in the image. Lclear and Lcloudy represent the radiance values observed by the satellite for the same pixel when it is in clear sky and sky covered by clouds, respectively. The values of Lclear and Lcloudy are determined from statistical analysis of satellite images obtained in similar situations of the geometry of pixel illumination by the Sun, i.e., approximately the same solar zenith angle.
The effective cloud cover index was determined based on the images from the geostationary satellite GOES 13 (already decommissioned) between 2012 and 2017 and GOES 16 for the remaining period between 2018 and 2021. The images in the visible channel (wavelength 0.64 µm) from the GOES 13 satellite have a spatial resolution of 4 km. Its time resolution (interval of acquisition of each image) was 30 minutes.
The GOES 16 satellite replaced GOES 13 and is the first of the new generation of satellites in the GOES family, with improvements in the spatial and time resolution of the data made available thanks to the ABI imager. Images in the visible channel (wavelength 0.64 µm), with a spatial resolution of 1.0 km and a 10-minute resolution, were used to create the Atlas. Table 3.1 summarizes the technical specifications of the two satellites. Figure 3.2 illustrates visible channel images obtained by the GOES 13 and 16 satellites.
Table 3.1 - Temporal frequency of image collection over the time adopted for elaborating the Solarimetric Atlas of Paraíba.

Click on the image to enlarge
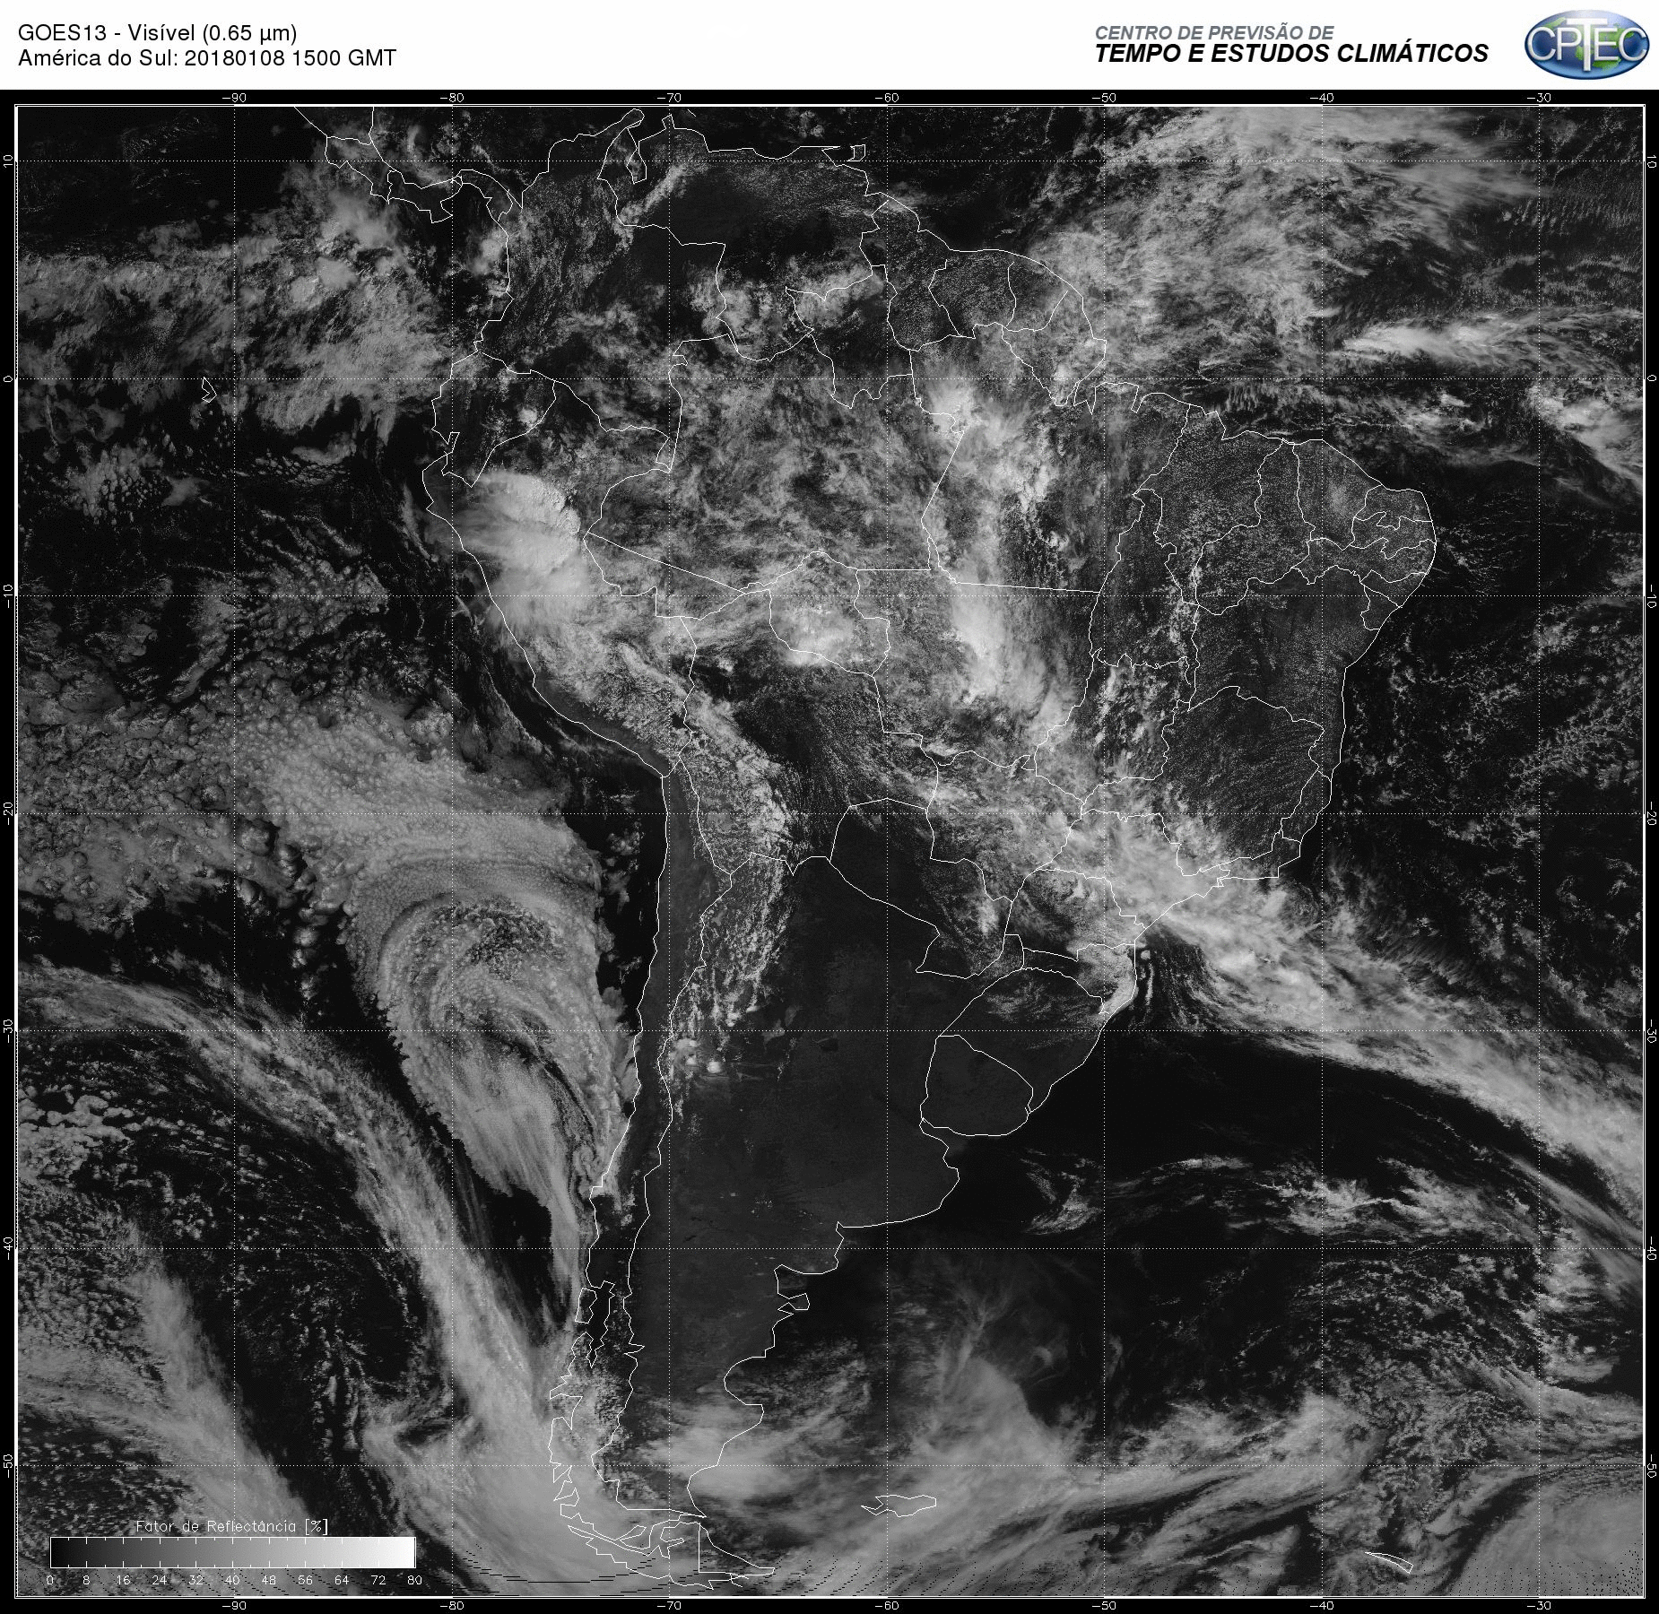

Figure 3.2 - Images in the visible channel of the satellites GOES 13 (left) and GOES 16 (right) in rectangular projection. Source: DISSM/INPE.
The BRASIL-SR model uses air temperature, relative humidity, and precipitable water values to establish the vertical profiles of atmospheric constituents. The air temperature values are fundamental to establishing the vertical profiles of the constituent gases of the atmosphere (Martins, 2001). Solar radiation interacts strongly with precipitable water, attenuating the solar irradiation incident on the surface. Its data is used to correct the water vapor profile in the atmospheric column. To produce the Atlas, the data for three meteorological variables available in the ERA-5 reanalysis database were also interpolated based on the nearest neighbor pixel method to the spatial resolution of the GOES satellite images. The ERA-5 reanalysis is available from the Copernicus Climate Change Service.
Ozone is the atmospheric constituent responsible for the attenuation of solar radiation in the ultraviolet spectral range. The database from the Copernicus Climate Change Service provided the ozone concentration in the atmospheric column to parameterize the radiative processes associated with UV spectral band. This database has a spatial resolution equal to 1°. Therefore, it is necessary to adjust the base to the spatial resolution presented by the satellite images. The vertical profile followed the standard atmosphere selected as a function of surface air temperature.
Albedo or reflection coefficient is the ratio between the radiation reflected by the surface and the radiation incident on it. It is dimensionless and is usually measured on a scale from zero to one. The bidirectional reflectance distribution function (BDRF) provides the reflectance of a target as a function of the illumination and viewing geometries, for example. The changes in reflectance and albedo of a given surface are related to its lighting geometry and surface type, being different for different wavelengths. The methodology to represent surface albedo variability uses the bidirectional reflectance distribution functions (FDRB), combining parameters such as isotropic scattering, scattering on horizontally homogeneous surfaces, and optical scattering geometric. Following these principles, the BRASIL-SR model uses ground spectral albedo data to calculate direct and diffuse solar irradiation by using parameters of the FDRB functions and polynomial formulas with coefficients independent of the wavelength. Monthly climatological values in seven wavelength bands were linearly interpolated for the 37 wavelength intervals adopted in the BRASIL-SR model. The database used for this processing is available for public access at http://tds.webservice-energy.org
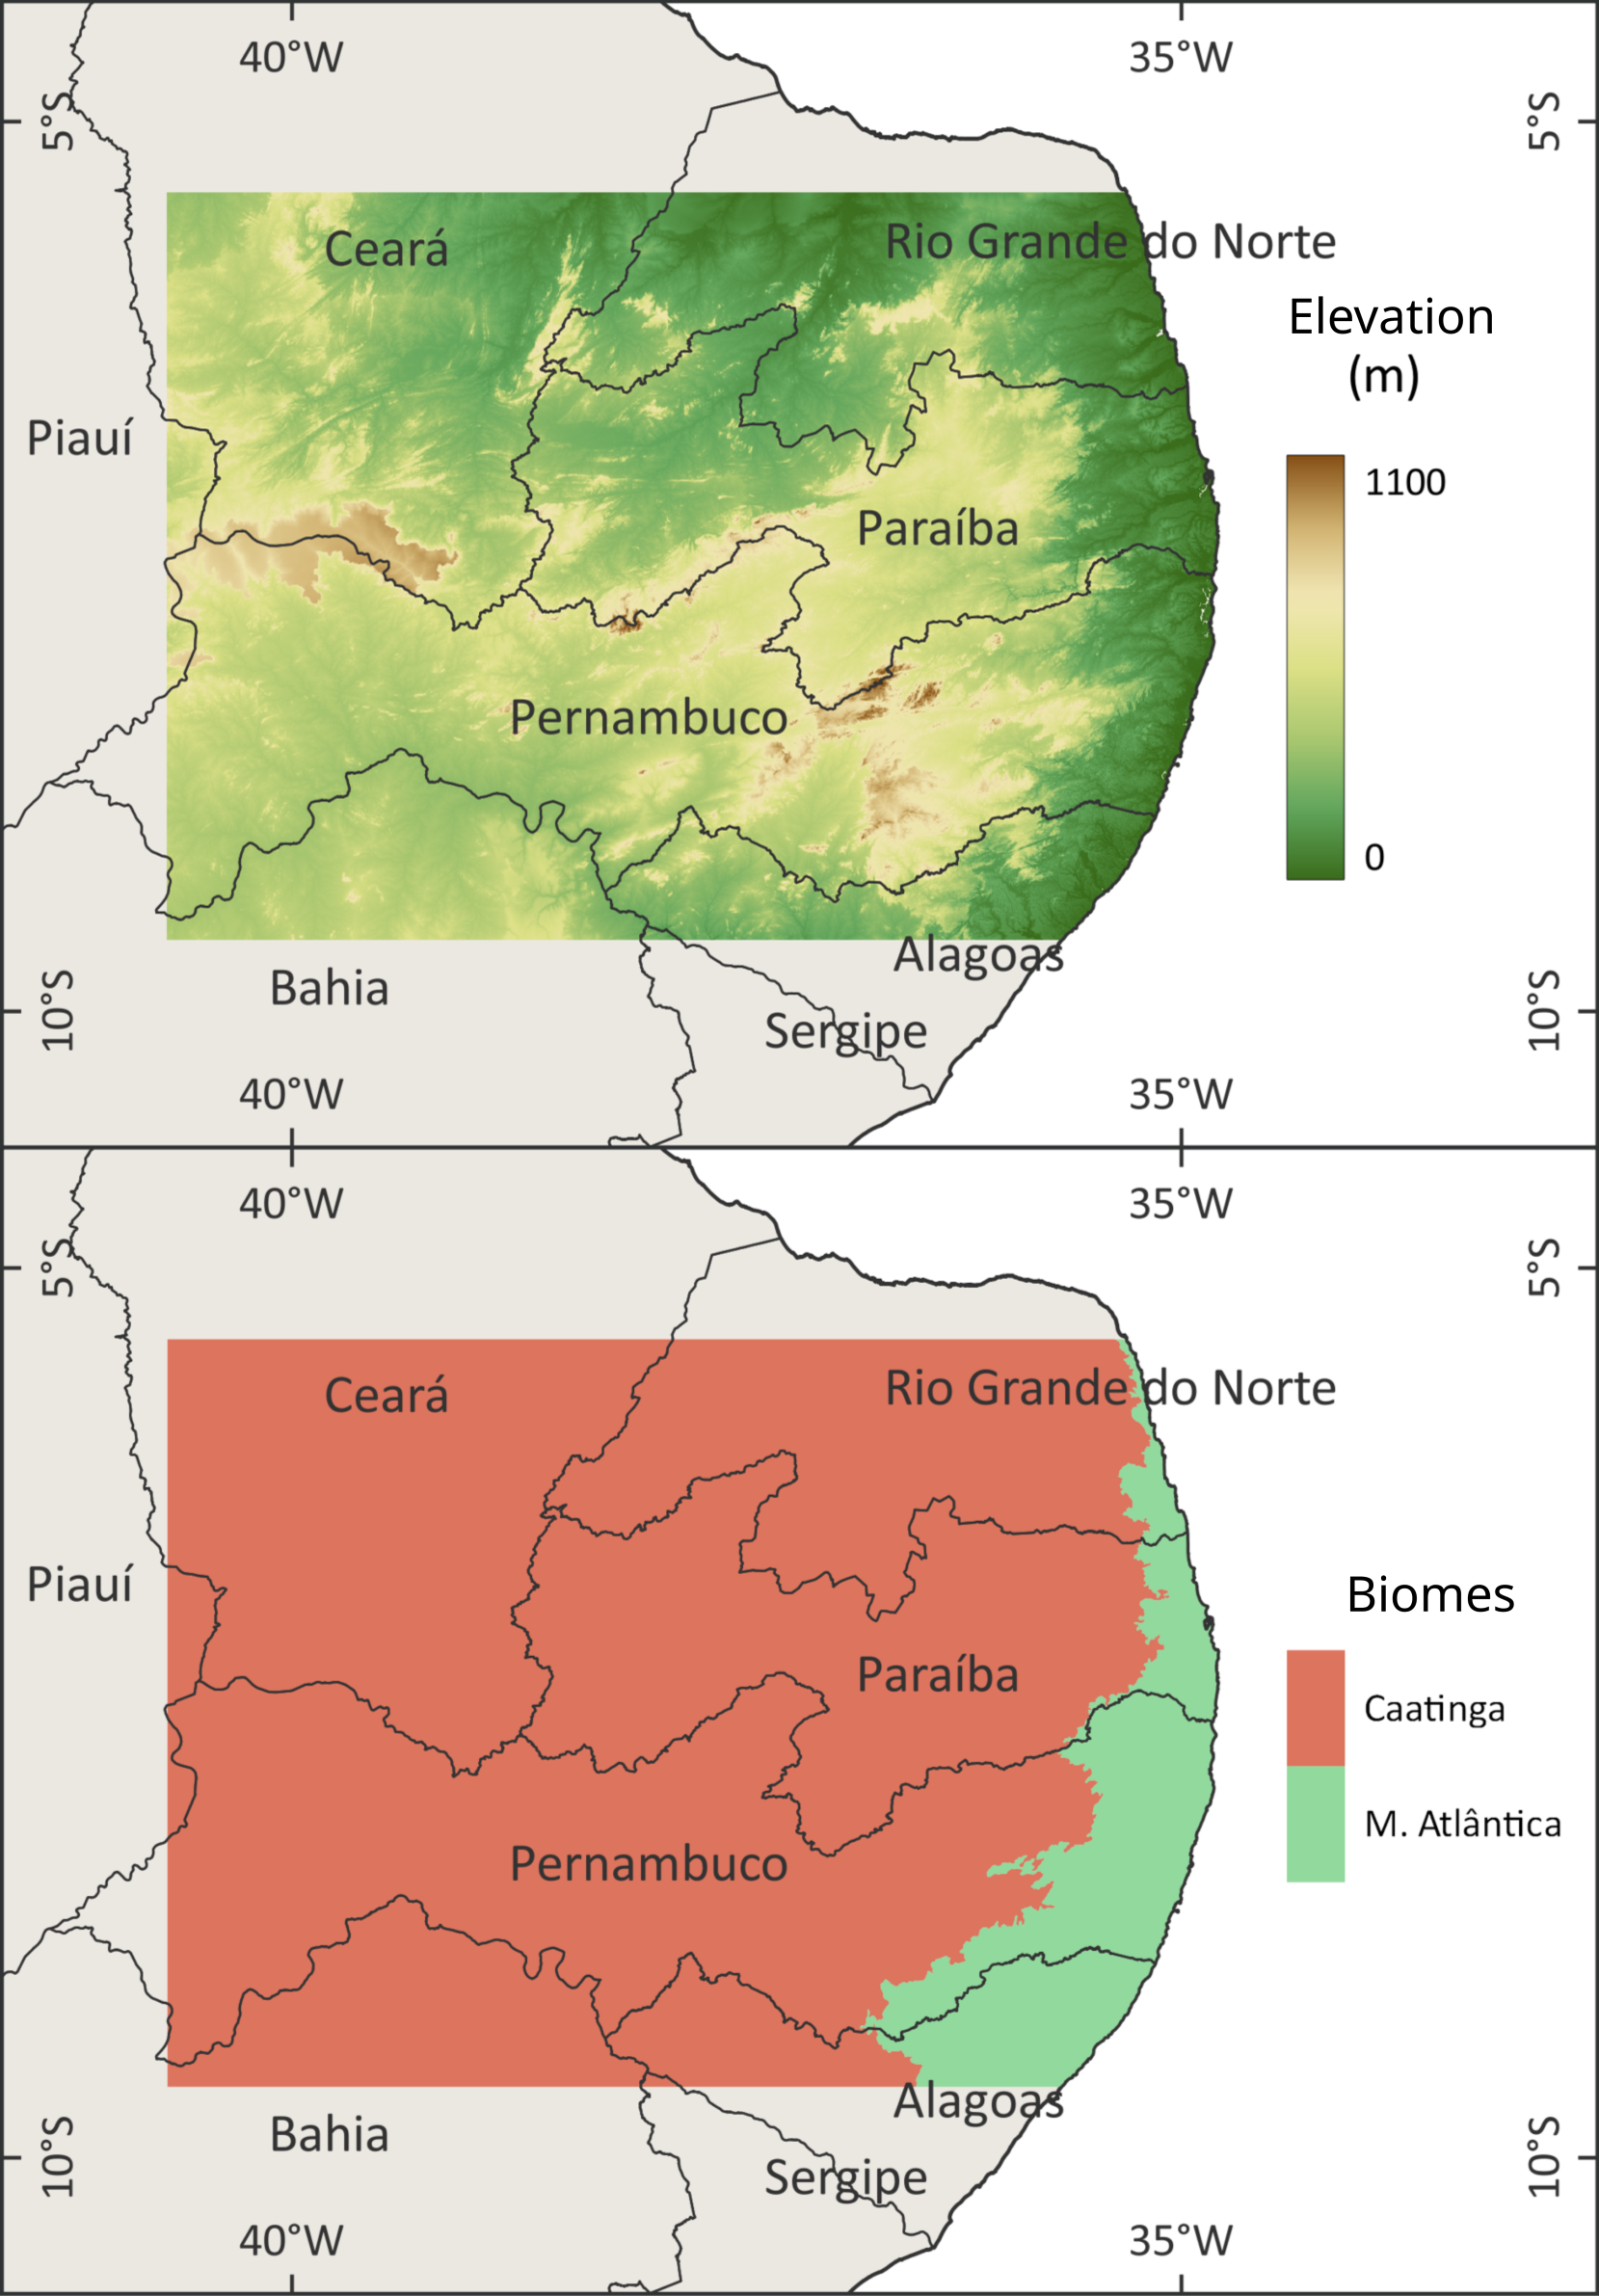
The model also uses topographic altitude data for correction and parameterization of some of the atmospheric variables and the biome map to select the set of optical properties of aerosols defined from the prevailing biome of each grid point. The altitude database for the Brazilian territory is the GTOPO30, from the Earth Resources Observation and Science (EROS) Data Center/United States Geological Survey (USGS). This database is available in grid format with an arc resolution of 30 sec (approximately 1 km) and vertical discretization of 100 m. Biome data come from the Brazilian Institute of Geography and Statistics (IBGE), with a map scale 1:250,000 (Figure 3.3). As with the other input data, the values are interpolated to the pixel size of the satellite images.
Click on the image to enlarge
Figure 3.3 - Relief maps (above) and biomes (below) used in the BRASIL-SR model.
Source: EROS/USGS and IBGE.
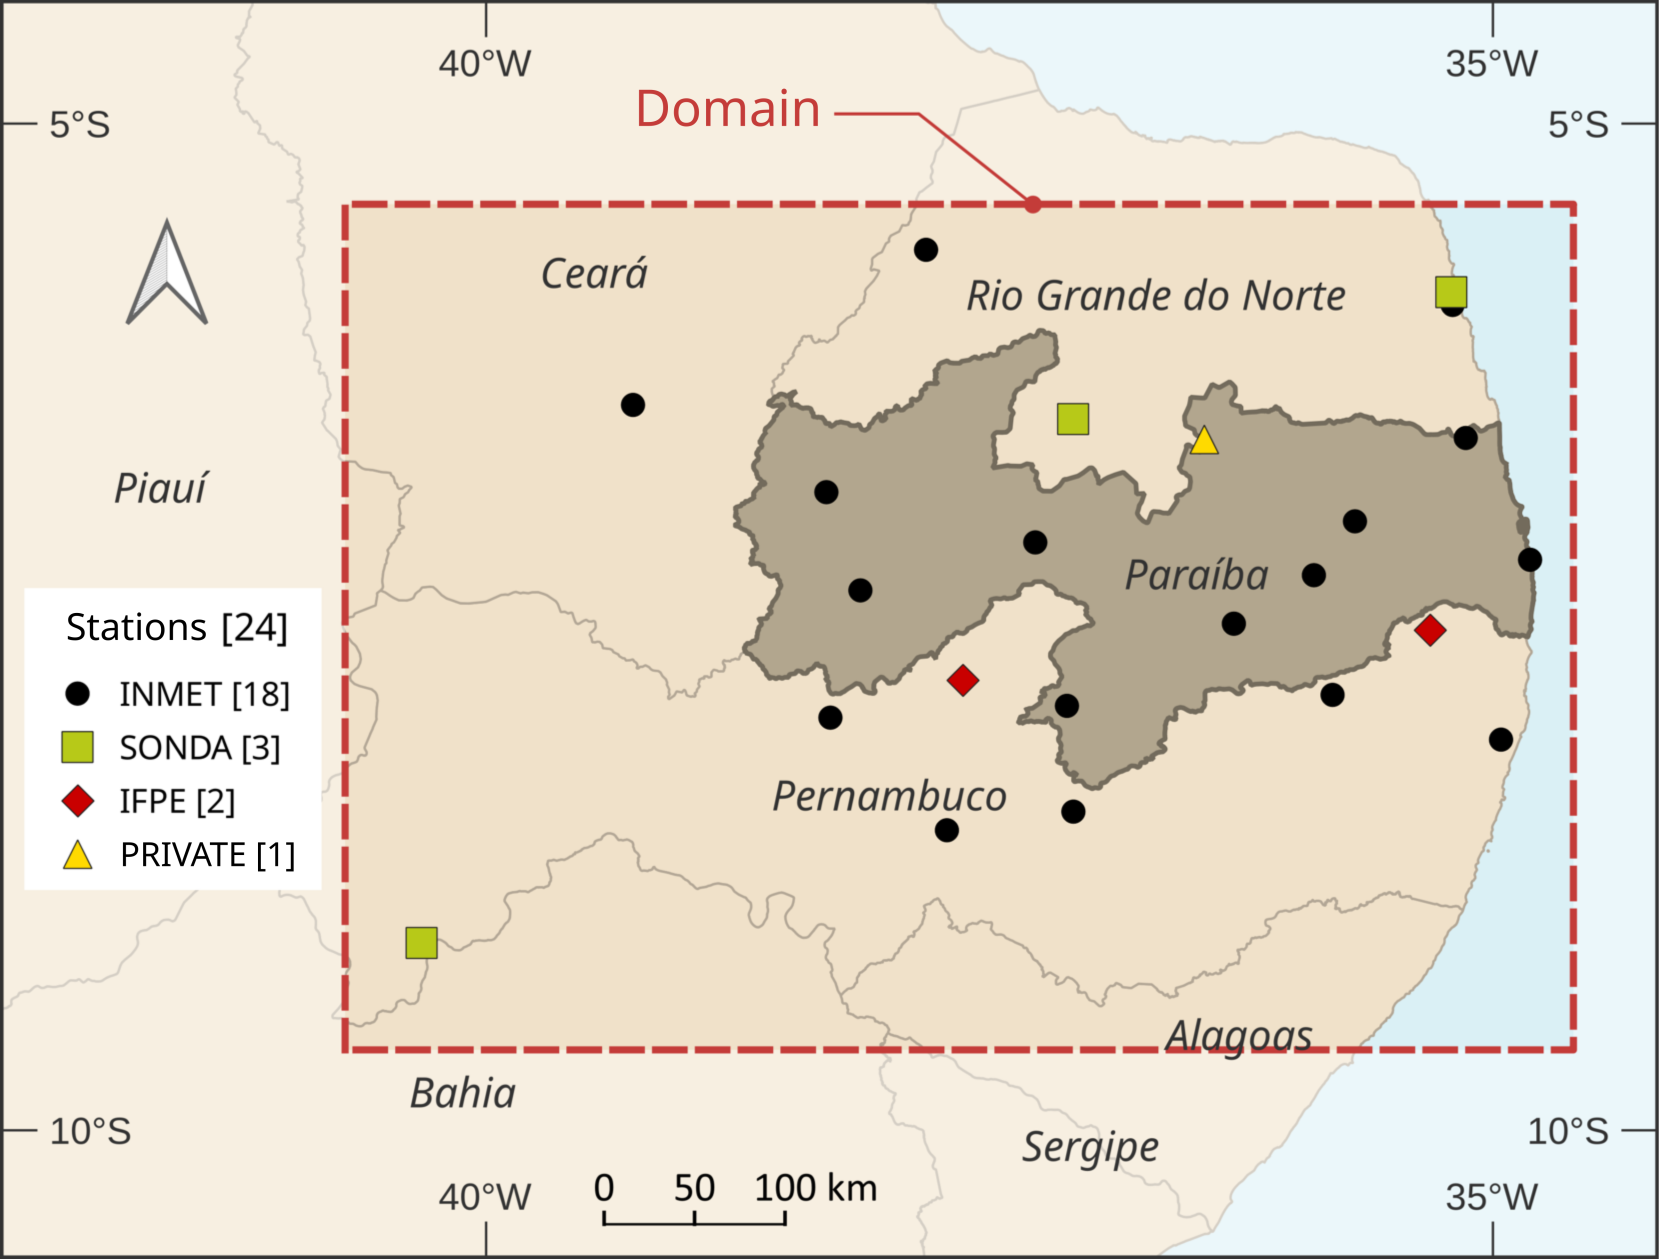
The BRASIL-SR model was run for a limited area domain, as illustrated in Figure 3.4, covering a region beyond the borders of the Paraíba state territory, with a rectangular grid in the horizontal resolution of 0.04° x 0.04° (~16 km²). This domain comprises latitudes between 9.46° south and 5.54° south and longitudes between 40.46° west and 34.62° west. The entire set of meteorological and environmental data used as input to the model was organized for the domain illustrated in Figure 3.4, including satellite images, air temperature, relative humidity, and optical thickness of aerosols.
Click on the image to enlarge
Figure 3.4 - The red dashed area represents the target area configuration of the BRASIL-SR model to obtain estimates of the daily total of incident solar irradiation on the surface. The dots indicate the location of the measuring stations.
The domain area was defined based on the location of meteorological stations with solarimetric data to assess the uncertainties in the estimates of surface solar irradiation produced by the model. Solarimetric data observed in the territory of Paraíba and neighboring states were selected to ensure the representativeness of the state's border areas and enable a rigorous evaluation of the BRASIL-SR model performance throughout the entire state area. The observed database includes a set of public meteorological stations managed by the National Institute of Meteorology (INMET), National Institute of Space Research (INPE), Federal Institute of Pernambuco (IFPE), and a private data collection station kindly provided by Casa dos Ventos.
The elaboration of the solar resource mapping presented in this document had a high computational demand due to the extension of the Paraíba territory, the amount of information stored in the meteorological and environmental databases, and the satellite images used to feed the model. The model was run for a period of 120 months (10 years) so that the computational demand met the following steps:
These listed steps were processed in a cloud computational system using the Amazon Elastic Compute Cloud (Amazon EC2) service (AWS). For greater computational efficiency, a T3a-type instance was chosen - an expandable general-purpose instance designed for applications facing temporary CPU usage peaks. The contracted infrastructure had eight virtual CPUs (AMD EPYC 7000 series processors at 2.5 GHz) and 32 GB of RAM memory, connected to a general-purpose SSD (solid-state storage drive) with a capacity of 100 GB for fast loading operating system and libraries, as well as an input/output-optimized HDD (hard disk) with a capacity of 1TB for storing the model's input and output data.
All computational packages supporting the model (including open-access scientific libraries such as NetCDF and HDF5) were recompiled to optimize their performance for the processors available in the instance. The compilers of the Intel OneAPI package (version 2022.1.0) ensured compatibility with the BRASIL-SR model and maximum application performance.
The final volume of the input database (calculated after pre-processing, which resizes the data to the domain grid and compresses the files) was approximately 27 GB. The processing took approximately 576 machine hours using the eight cores full-time, not including rounds for testing, evaluating and adjusting model settings, or downloading and pre-processing input data. At the end of the runs, 297 GB of model output data were generated, of which 283 GB comprise high-resolution data (0.01° x 0.01°).
Atmospheric or satellite models are valuable tools for mapping solar resources at high resolution. However, uncertainties must be quantified, as they represent risks in a solar project. The validation of the modeling used for this Atlas consisted of comparing the estimates of daily totals of solar irradiation in its global horizontal (GHI) and direct normal (DNI) components, provided by the satellite model, with a database of observed data collected at surface measurement. These data sets were not used to adjust the BRASIL-SR model results statistically, ensuring that the errors represent the entire state of Paraíba.
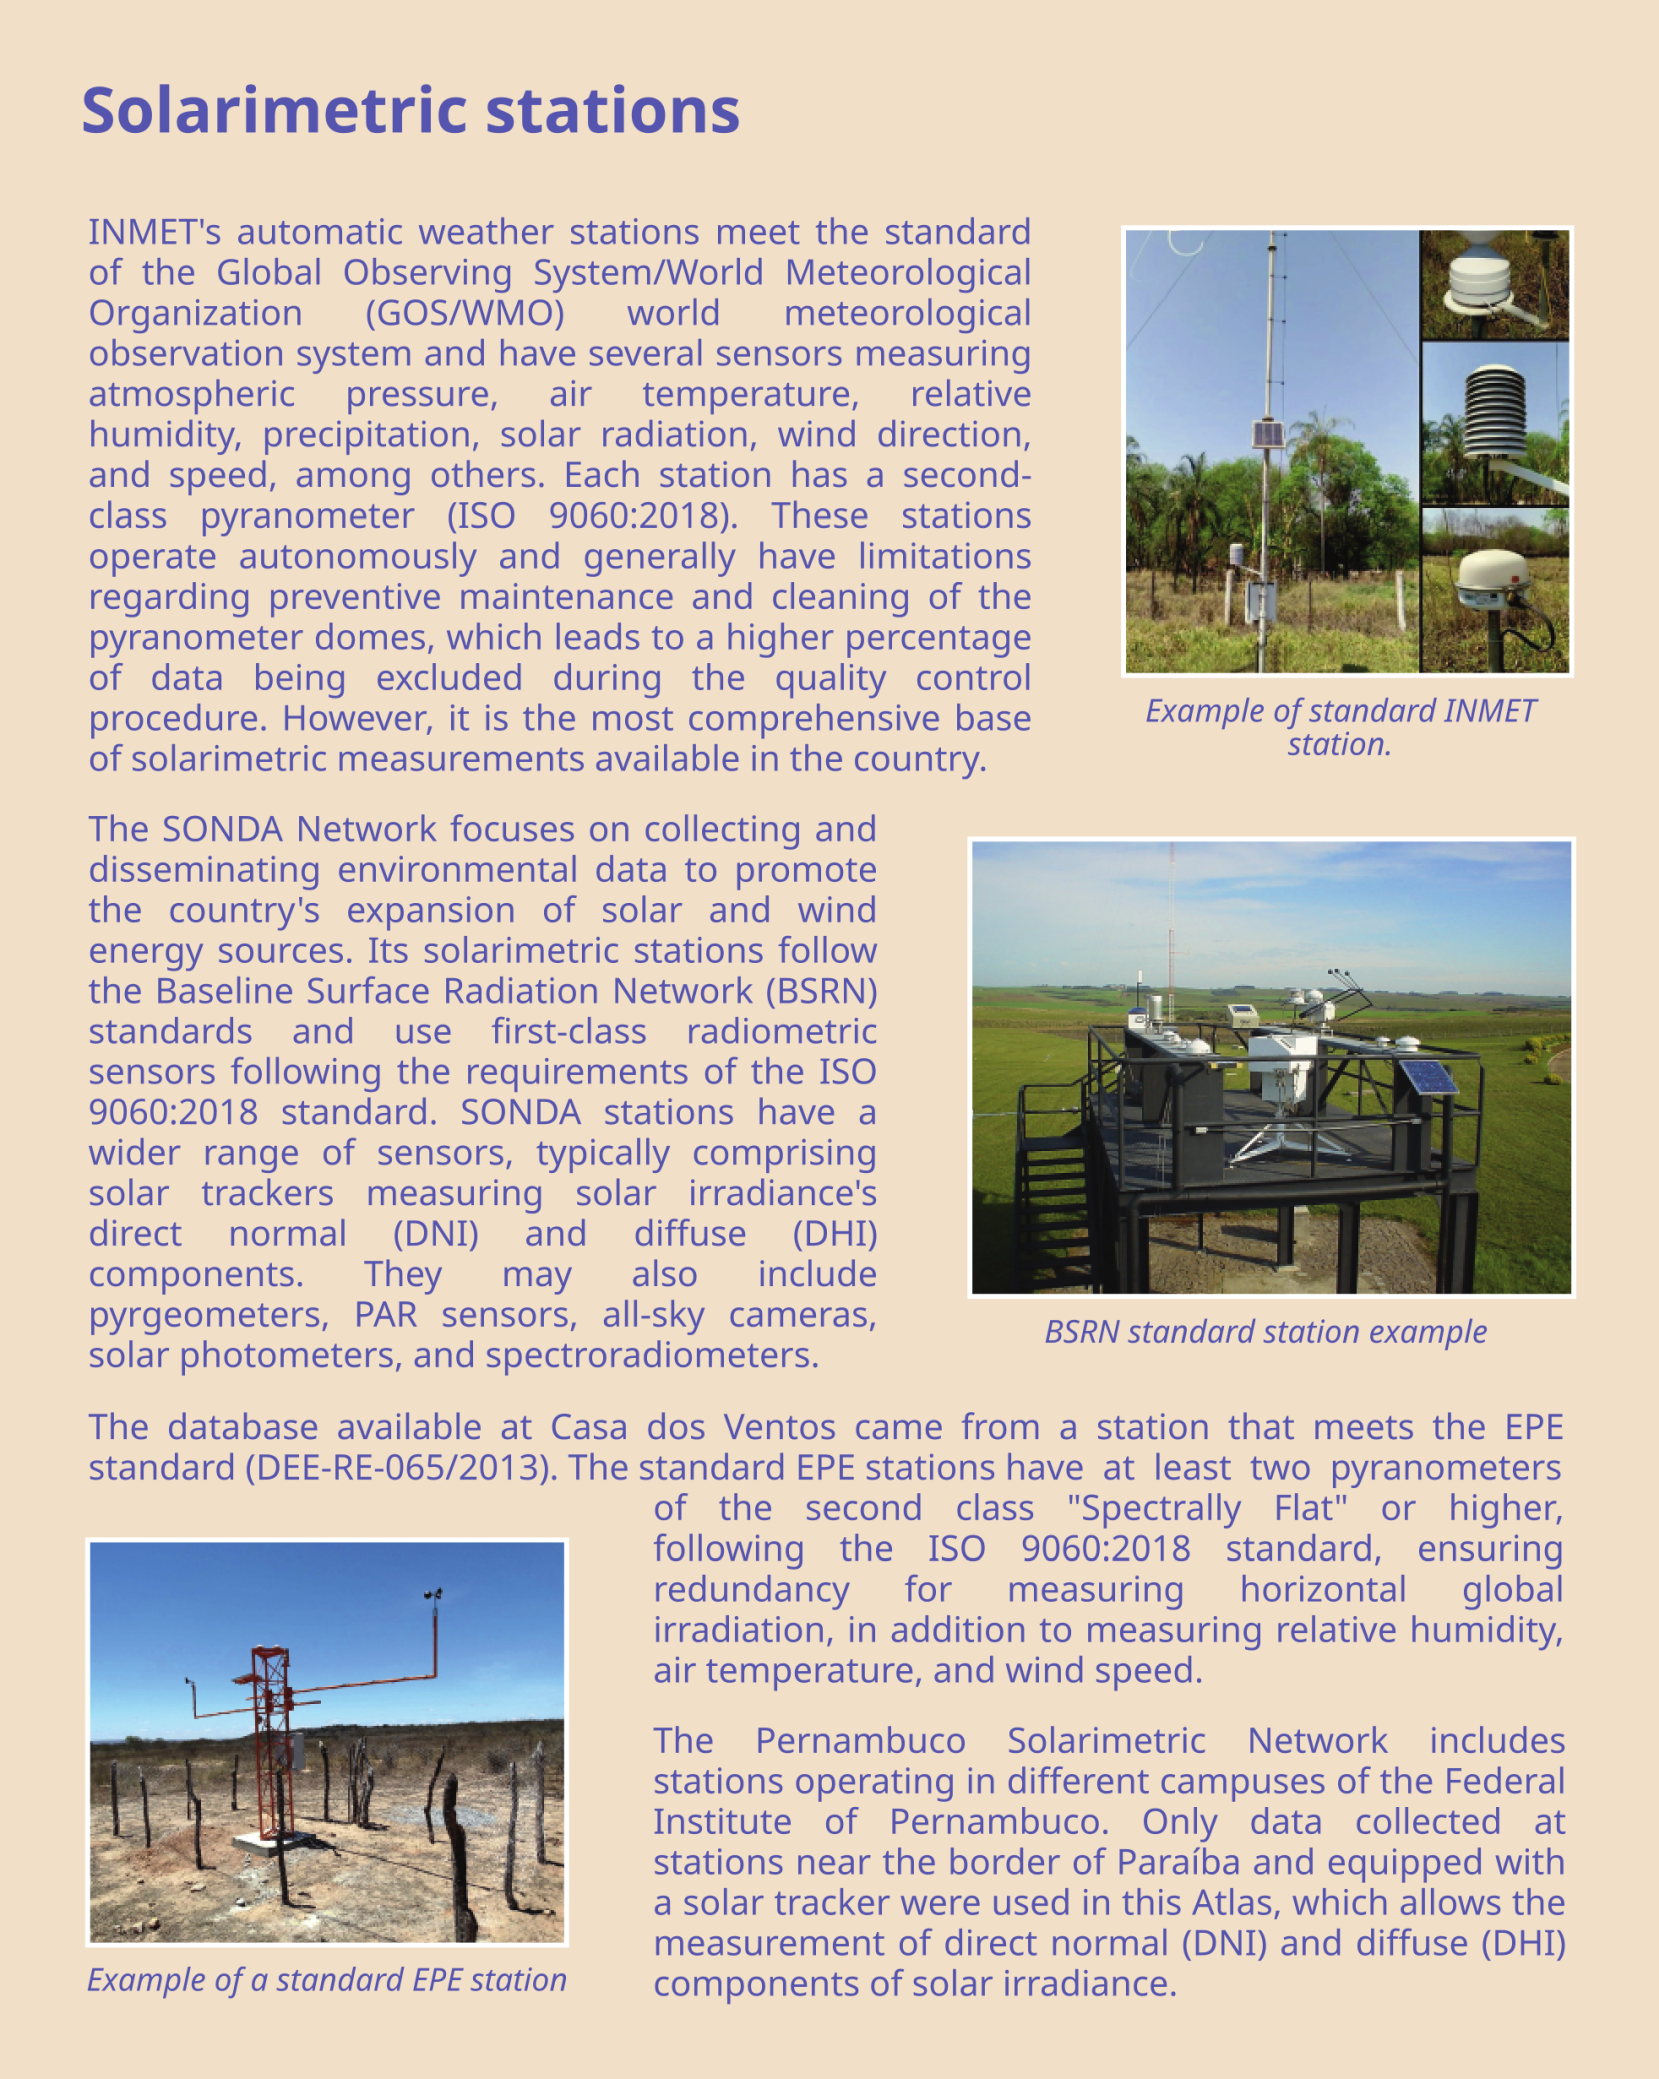
The validation procedure used data from 24 solarimetric stations belonging to meteorological centers, research and teaching institutions, and private entrepreneurs to guarantee total coverage and spatial representativeness of the state of Paraíba and its surroundings. After a quality control process, described in a later chapter, 24 stations with reliable global solar irradiance measurements were selected, 4 of which have direct irradiance data records:
Click on the image to enlarge
It is common for solarimetric measurements to have flaws and data quality problems over the years. In such context, the quality control of the observed data is required before they can be used to assess the uncertainties in solar irradiance estimates by computer models. In addition to the accumulation of dirt in radiometers, which is quite common, calibration regularity, signal conversion errors, and interference caused by obstacles are some of the most frequent problems.
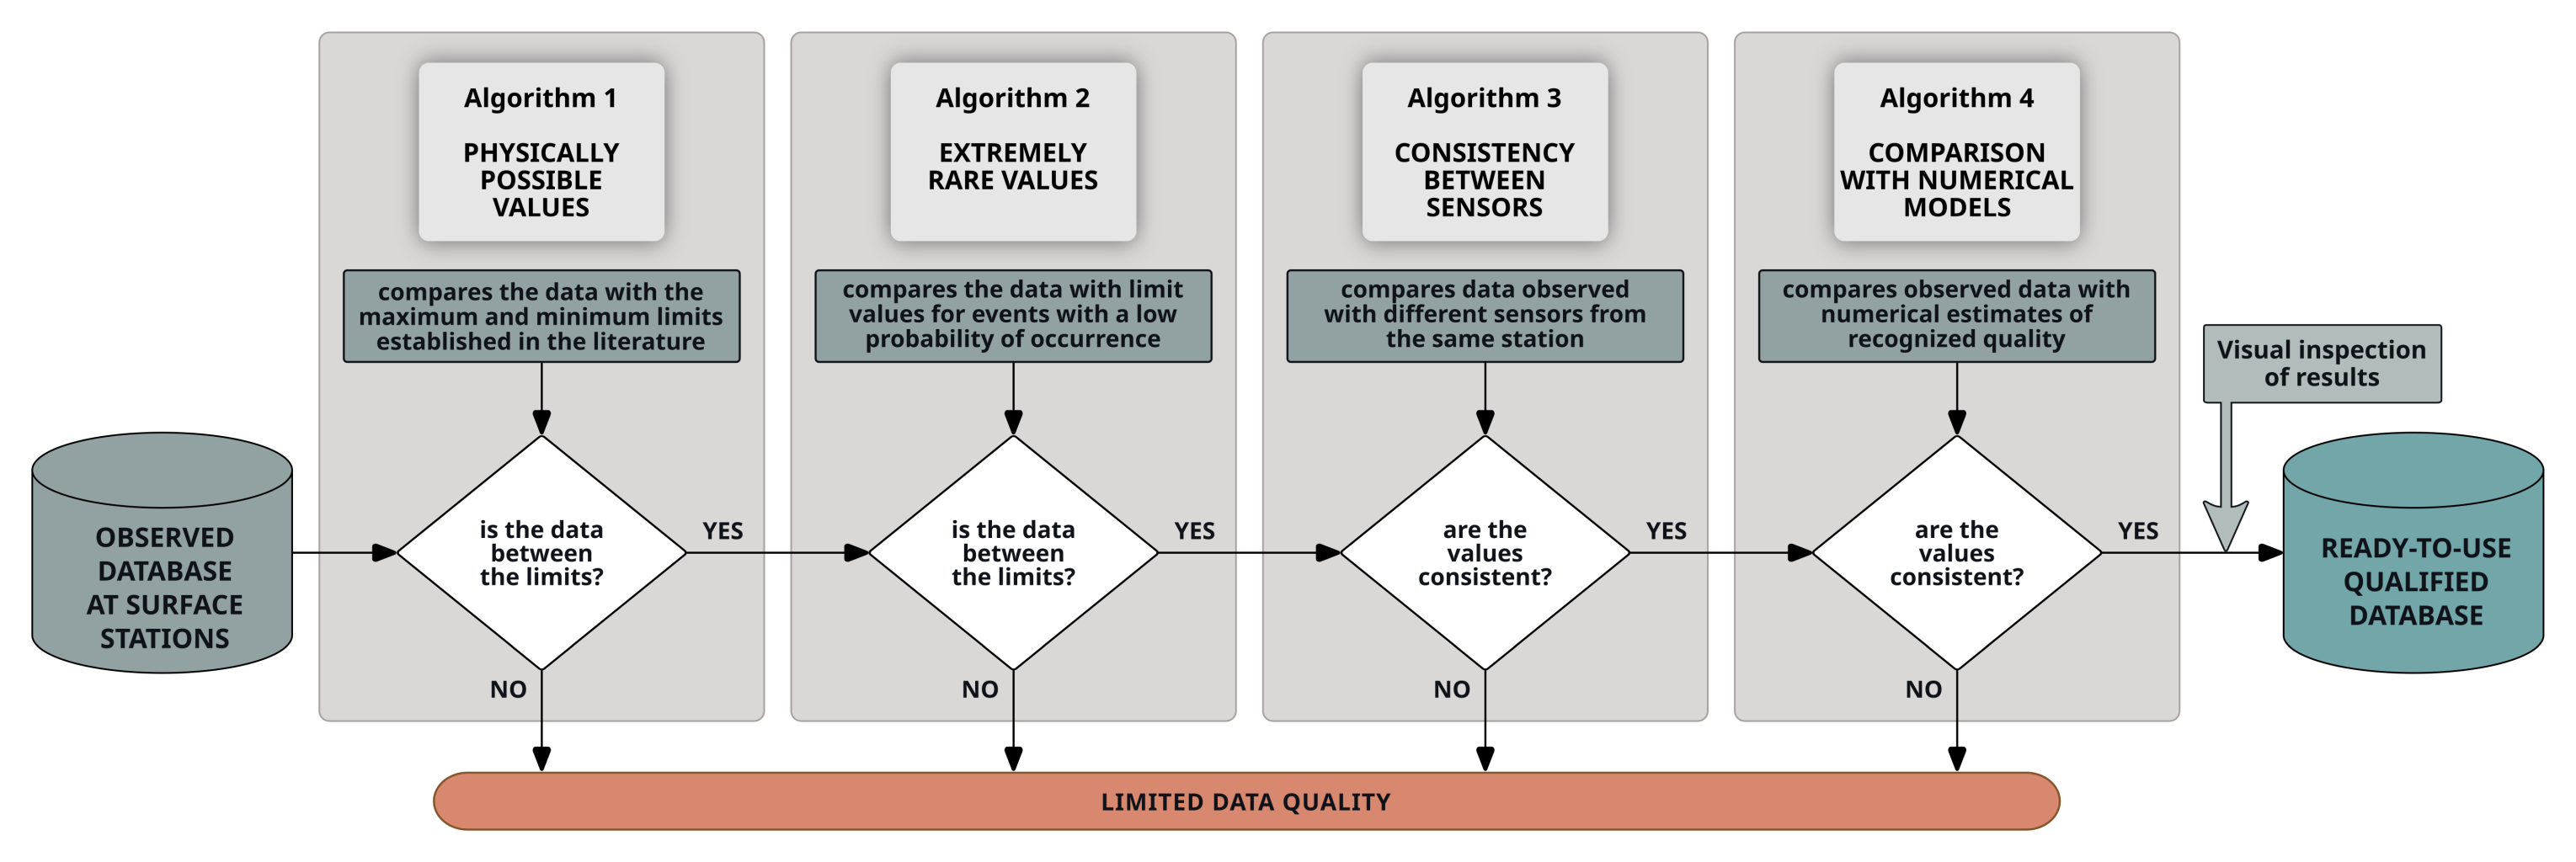
The quality control met the criteria recommended internationally by the BSRN (Baseline Surface Radiation Network) combined with other technical-scientific documents (Gueymard, 2014; WMO no. 8, 2018). The algorithm was divided into four gradually more rigorous stages in addition to a prior consistency analysis. As the automated qualification process is subject to failures, a visual inspection was also carried out for final approval of the measurements. Figure 3.5 graphically illustrates, in a block diagram, this procedure. At the same time, Table 3.2 shows the total percentage of approved data for the GHI and DNI variables.
Click on the image to enlarge
Figure 3.5 - Flowchart of the quality control process of solarimetric data used in this Atlas.
Table 3.2 - Total percentage of approved data for the GHI and DNI variables after the qualification process, considering the total number of evaluated stations.

Click on the image to enlarge
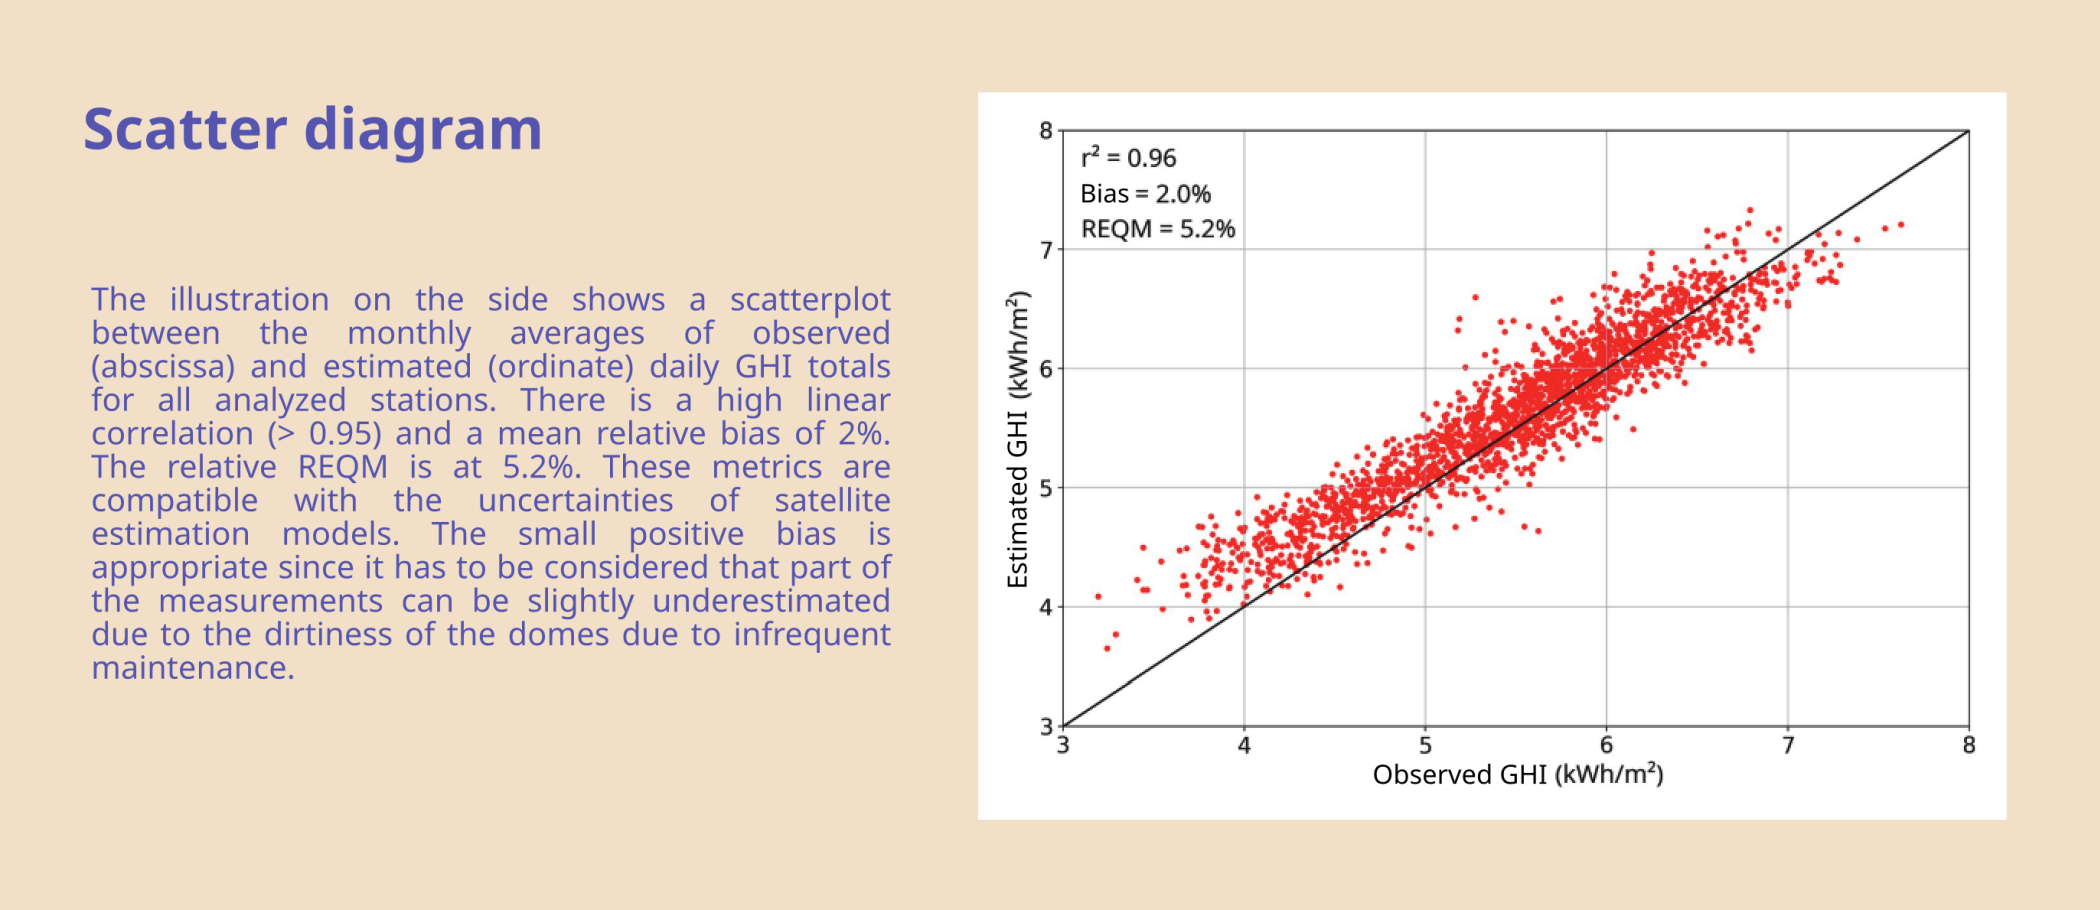
Comparisons between model data and surface measurements were performed for each station individually and for the entire available data set. Conventional statistical metrics defined by Mean Error (bias) and Root Mean Squared Error (REQM) were used. The bias indicates the model's tendency to overestimate (positive values) or underestimate (negative values) the solar potential at the location, meanwhile the REQM is a measure of the spread between the measured data and the data estimated by the model so that the smaller the REQM values, the better the model performance. Pearson's correlation (r) is a test that measures the statistical relationship between the irradiation estimated by the model and the values observed at surface stations. A linear association is expected between these two sets of values, so the r values must be close to 1.0 (one). Equations 1, 2, and 3 detail these indices.
 (Eq. 1)
 (Eq. 2)
 (Eq. 3)
where yi is the observed value of the variable at the i th instant of time, xi is the value of the same variable estimated by the model corresponding to the same instant of time as the observed value, and N is the number of records of the variable being validated.
High values of bias and REQM obtained for some locations are related to modeling and surface measurement uncertainties. Problems related to radiometers soiling, calibration, and even shading effects due to improper location of the measuring station are challenging to detect and often need to be noticed by the quality control method applied to the observed data and even by visual inspection. Therefore, assessing and quantifying these issues whenever possible over a large set of measurement stations is advisable to reduce the impact of measurement uncertainties.
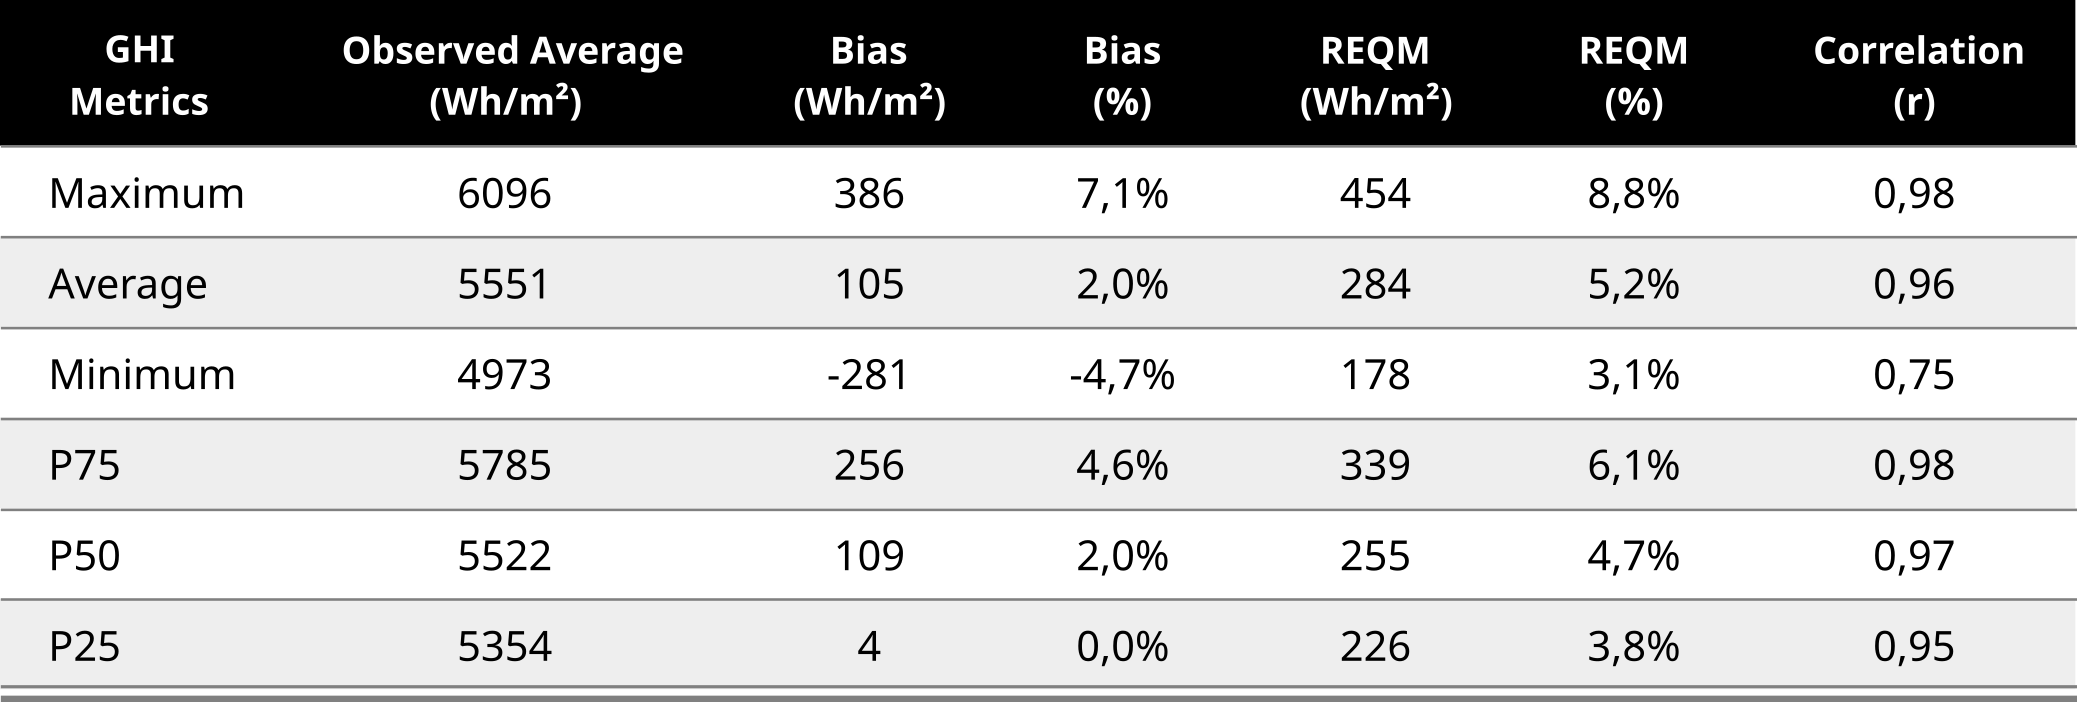
Tables 3.3 and 3.4 summarize the validation metrics obtained for the GHI and DNI for all stations selected in the mapped domain.
Table 3.3 - Validation metrics of model outputs for daily total horizontal global irradiation.
Click on the image to enlarge
Table 3.4 - Validation metrics of model outputs for daily totals of normal direct irradiation.

Click on the image to enlarge
Percentual bias and REQM were evaluted based on the mean value of observations at measurement sites used in the validation process.
The percentiles provide information on the fraction of observations (or deviations) that are below their value, calculated on a monthly basis. Thus, for example, the 25th Percentile, or P₂₅, represents the upper limit of 25% of the records present in the statistical analysis, and so on.
The deviations of each station have the same weight in the determination of the percentiles and in the final averages. The mean refers to the arithmetic mean of all 24 stations employed in the validation process that passed quality control. There is no weighting by data period.
Click on the image to enlarge
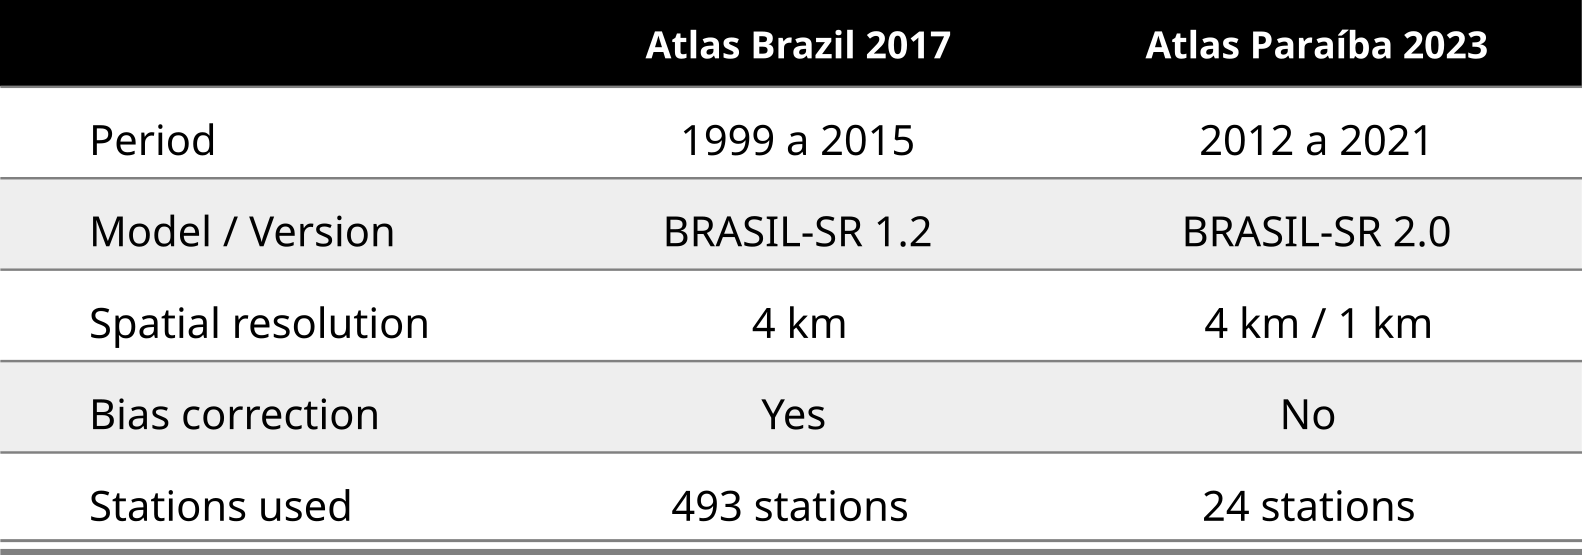
Several solarimetric databases are available, regionally, nationally, and globally, originating from different methods such as interpolation between surface stations, mesoscale or global dynamic modeling (reanalysis), and satellite models. The database of the Solar Energy Atlas of the State of Paraíba (Paraíba, 2022) was developed and validated using the BRASIL-SR satellite model, the same tool widely disseminated through the Brazilian Atlas of Solar Energy (Brasil, 2017). It should be noted, however, that these databases have different characteristics, as highlighted in Table 3.5.
Table 3.5 - Main differences between the databases generated for the Paraíba Solarimetric Energy Atlas (2023) and the Brazilian Solar Energy Atlas (2017).
Click on the image to enlarge
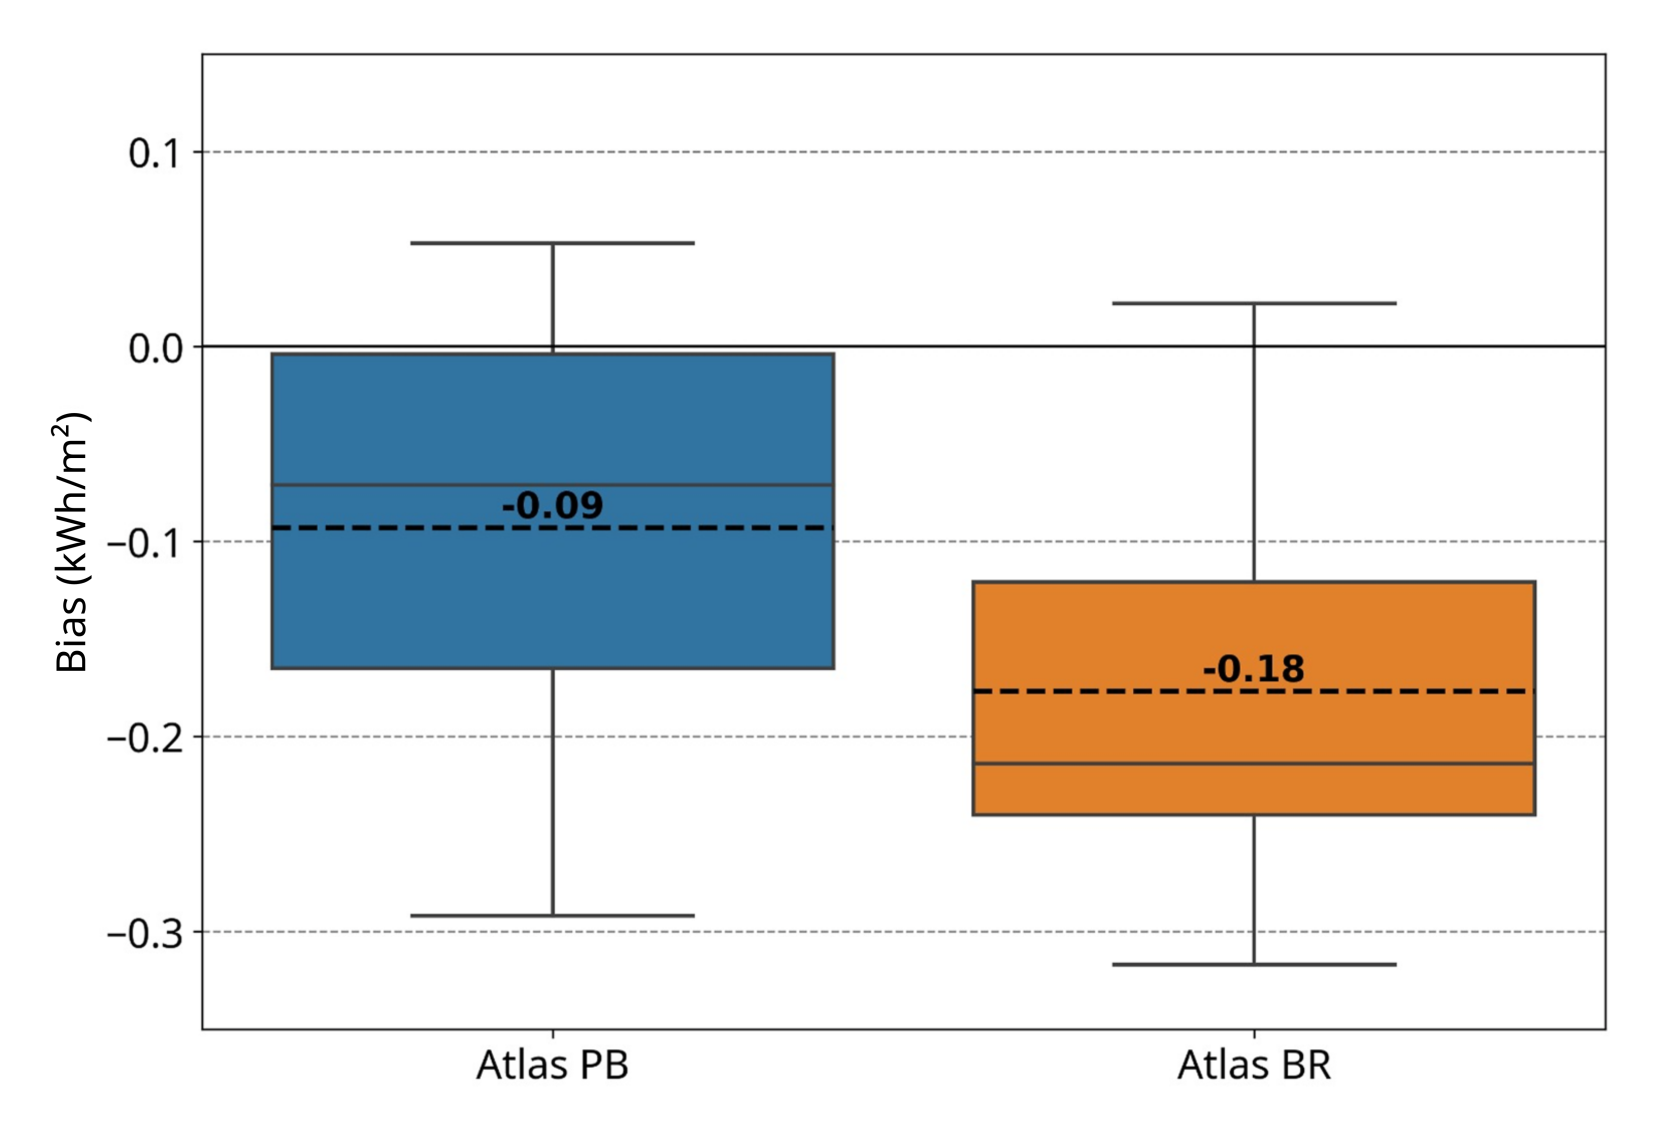
Version 2.0 of the BRASIL-SR model brought critical improvements in clear-sky algorithms, surface reflectance functions, and the detection of sparse cloudiness on dry days. Furthermore, parameters for cloud transmittance were explicitly adjusted for the region of interest. To illustrate performance differences and show the importance of regionalized solar modeling, Figure 3.6 compares the results of this Atlas (Atlas PB) with those of the Brazilian Atlas of Solar Energy database (Atlas BR) for a subset of high-reliability measurements. It can be seen from Figure 3.6 that the average bias for the Atlas PB was -0.09 kWh/m² against -0.18 kWh/m² for the Atlas BR. Such low uncertainties are due to the improved version of the BRASIL-SR model and state-specific parameterization adjustments. This made the bias correction unnecessary, as the uncertainty of the estimates was close to the uncertainties of the field measurements themselves. Therefore, this Atlas presents higher reliability for solar radiation estimates for the State of Paraíba.
Click on the image to enlarge
Figure 3.6 - Bias differences between the solarimetric bases of Brazil-2017 (Atlas BR) and Paraíba-2023 (Atlas PB) for the subset of high-reliability measurements. The maximum and minimum limits, the median (solid line), and the interquartile range (boxes) are shown. Means (dashed line) follow the value labels.