
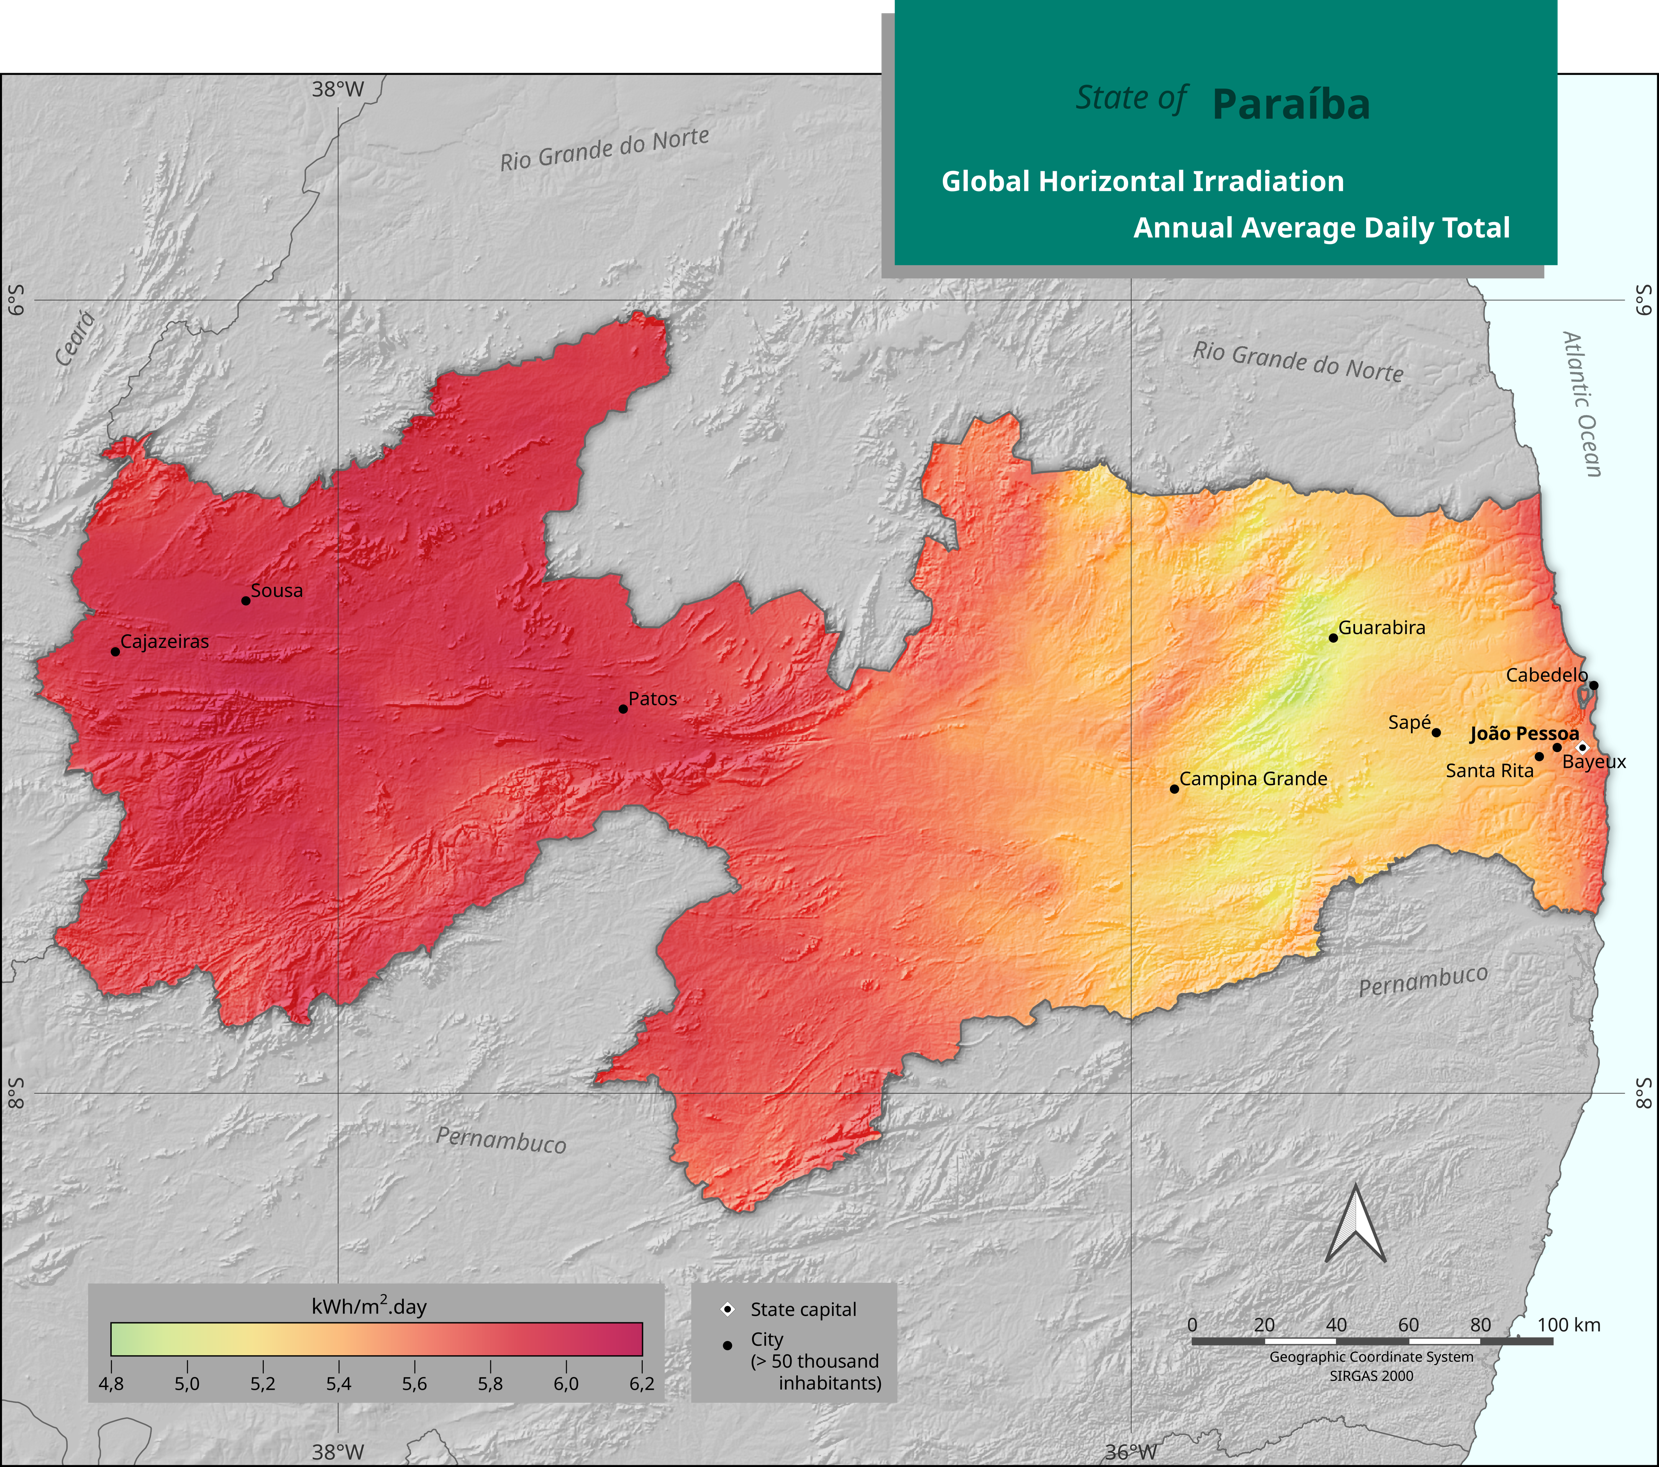
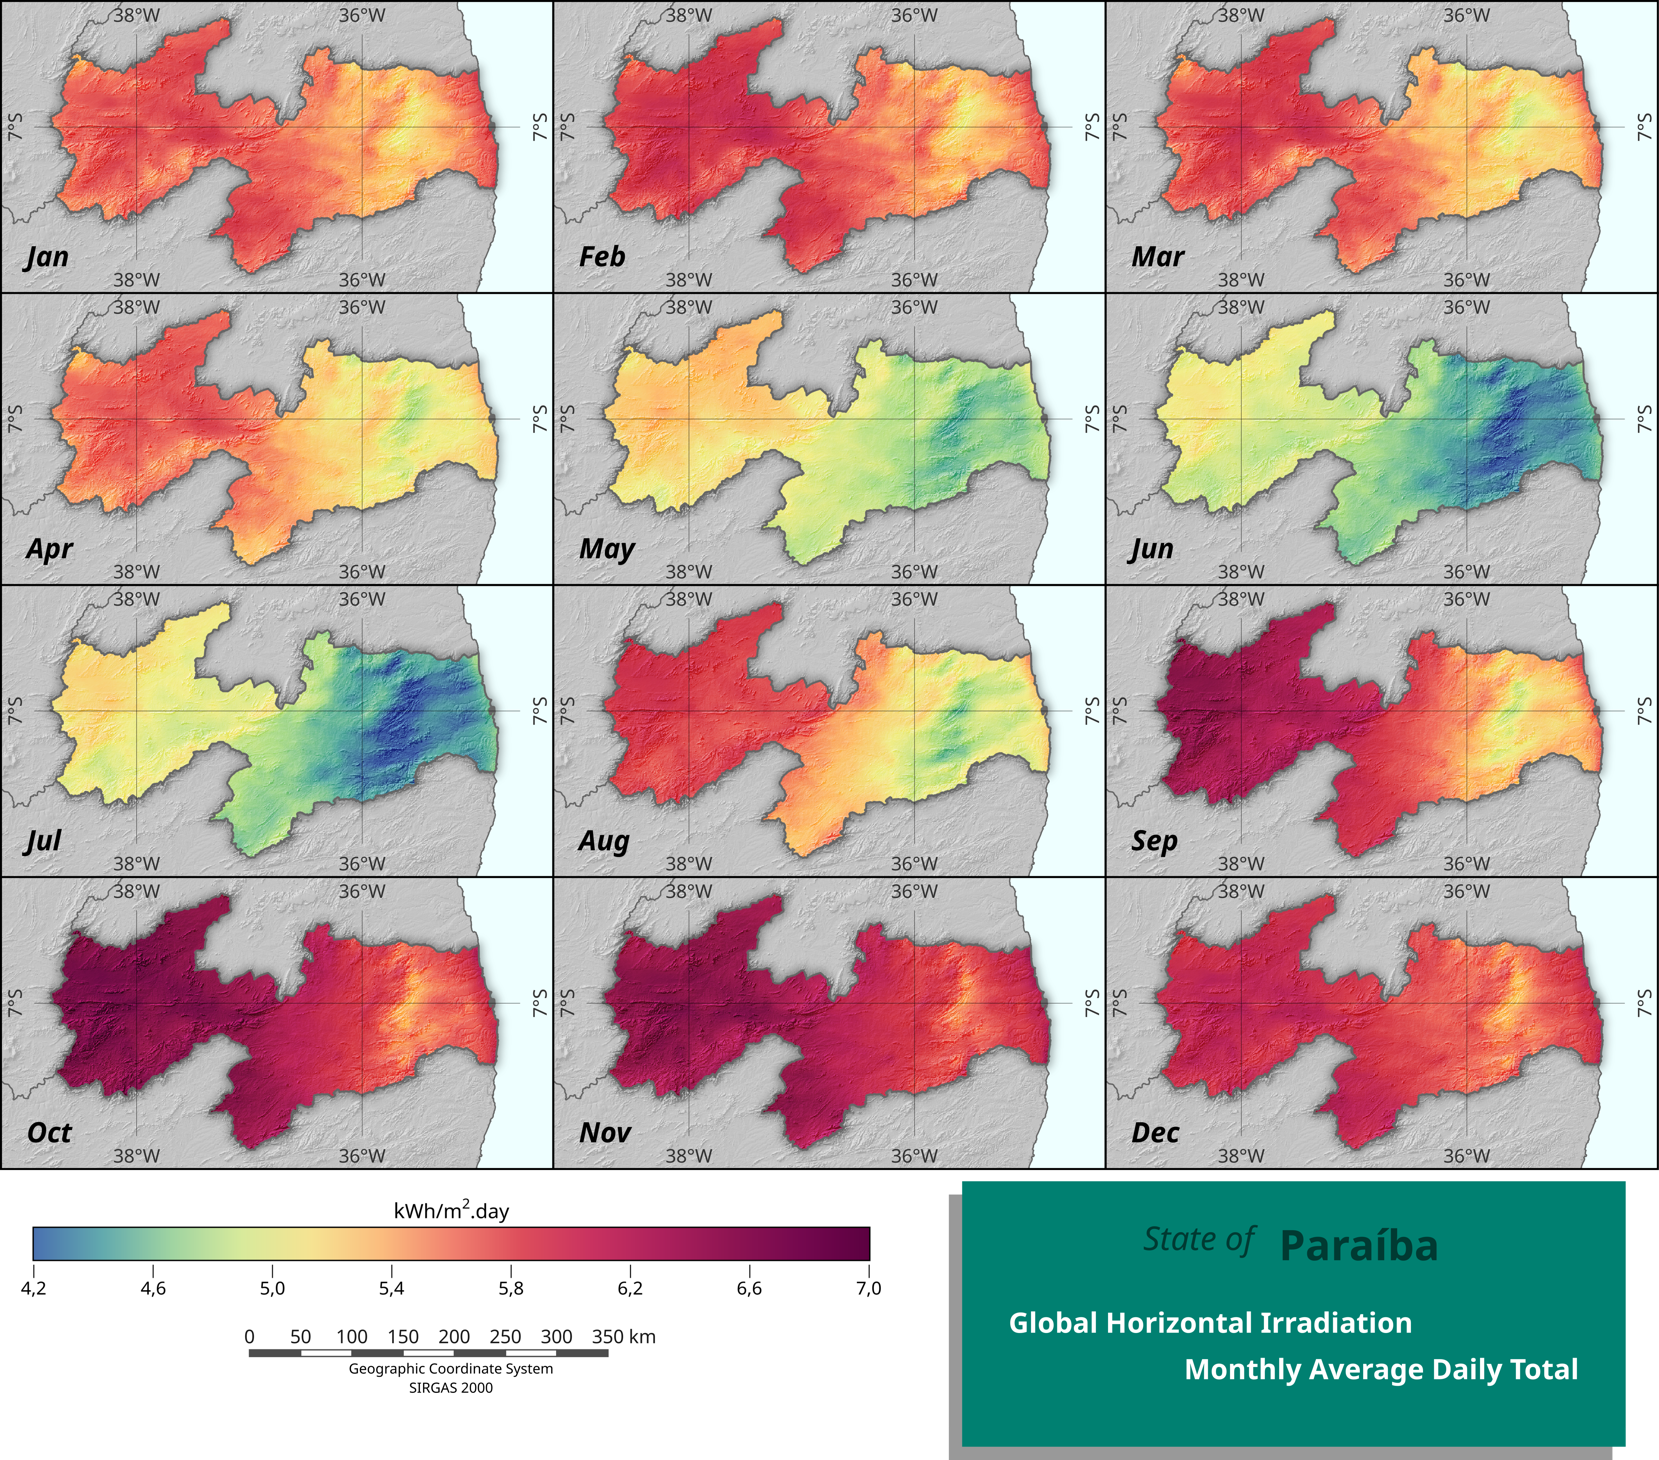
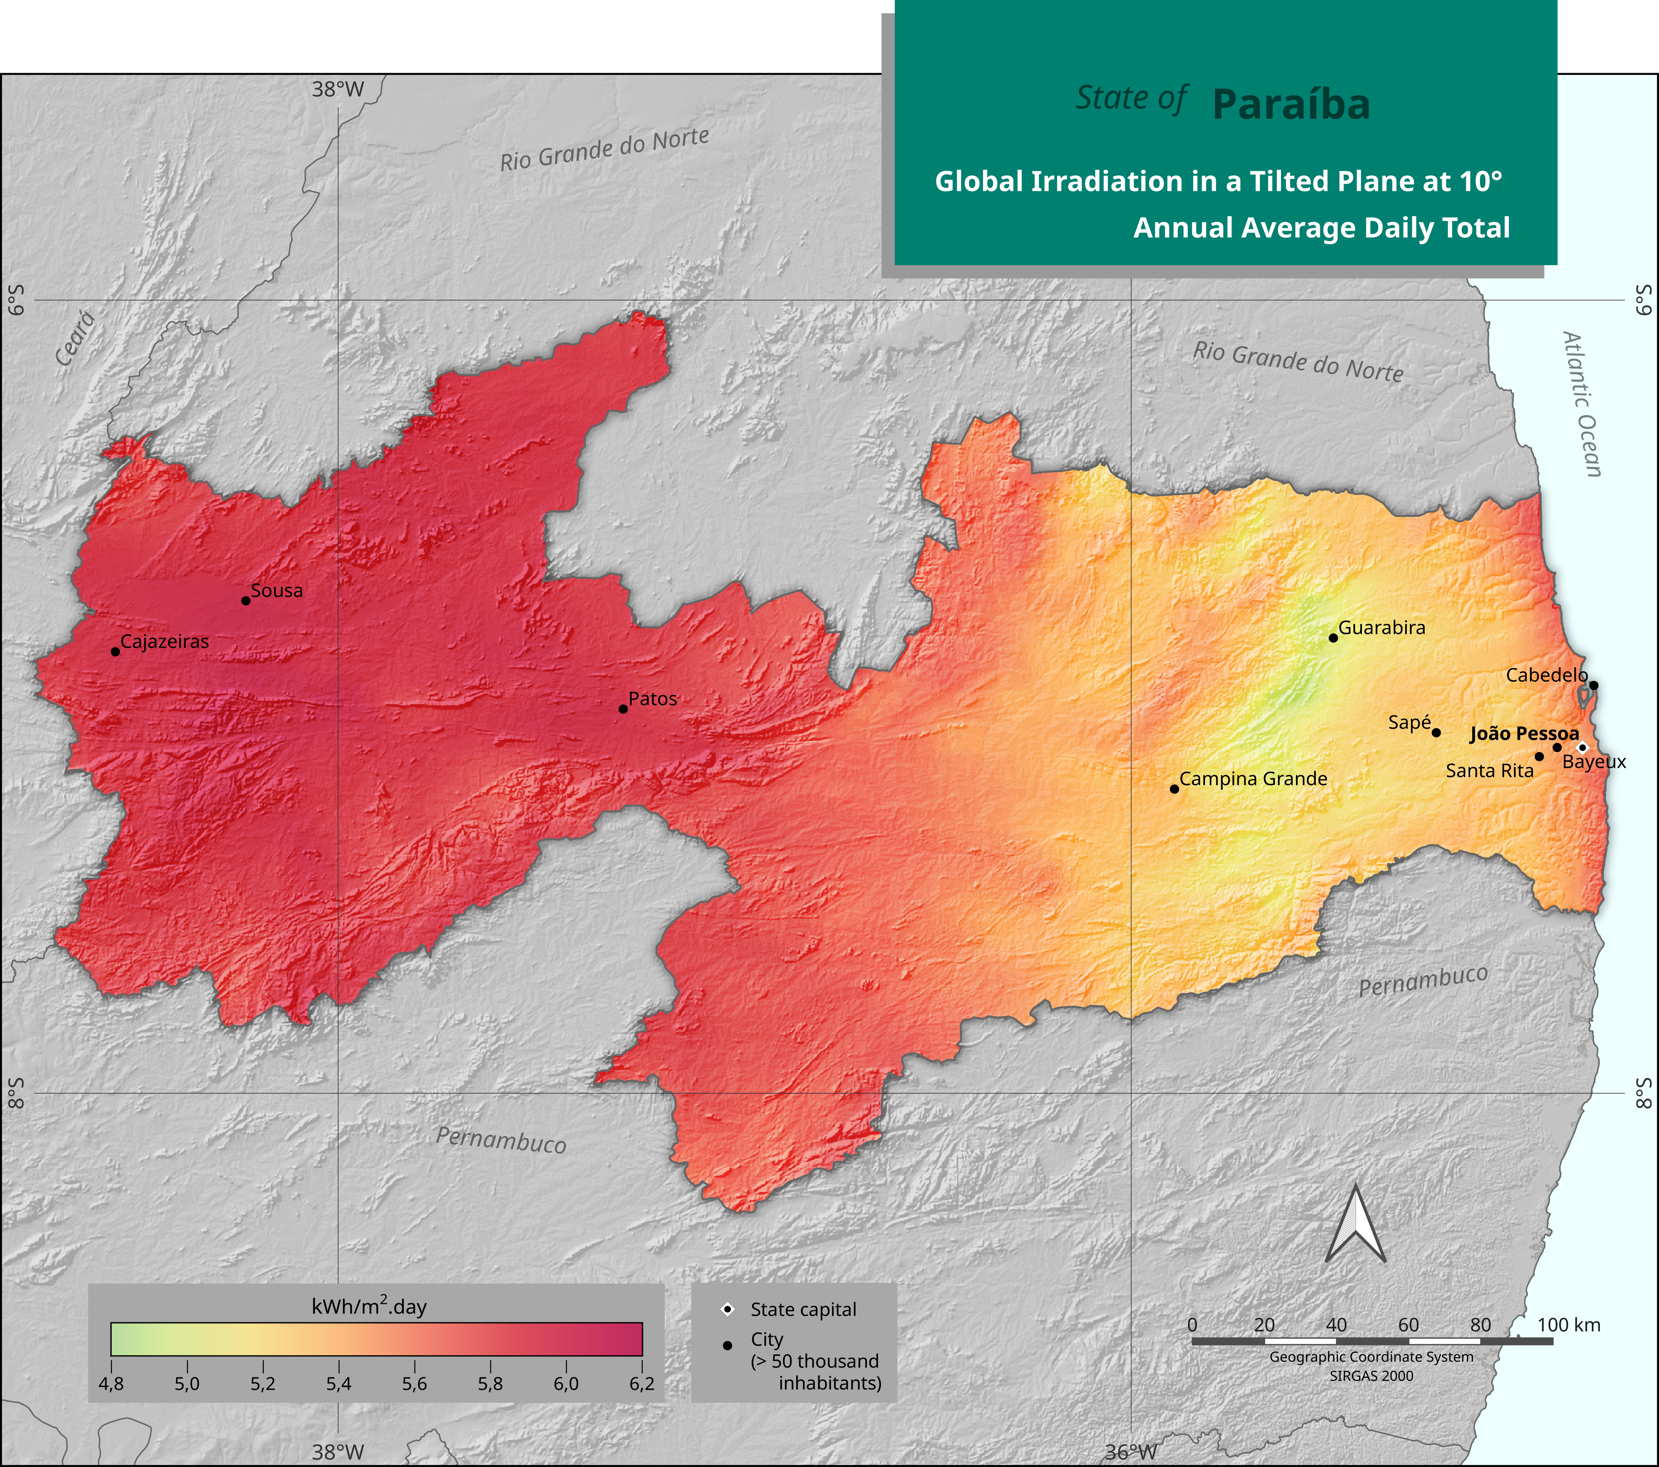
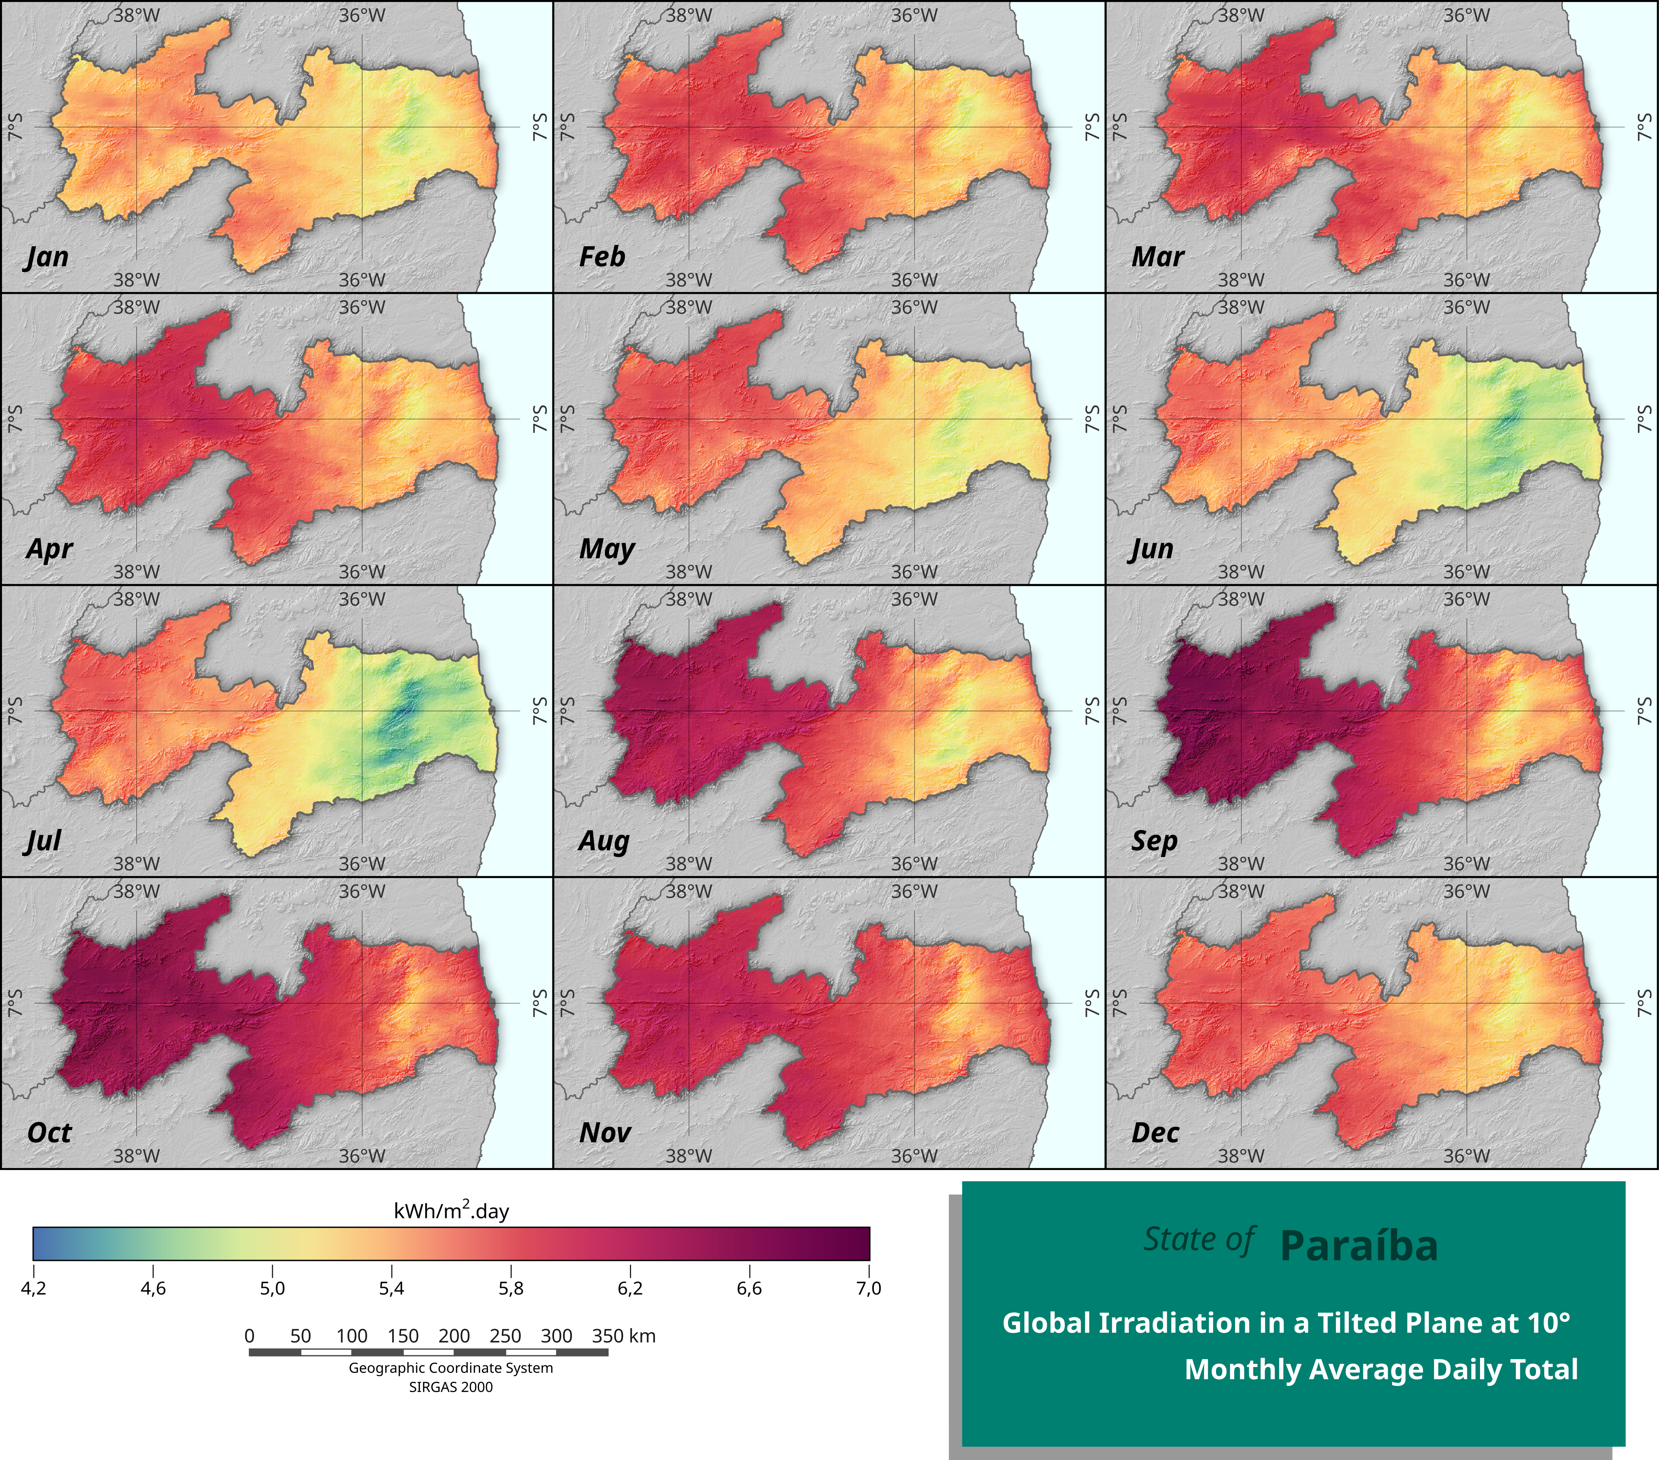
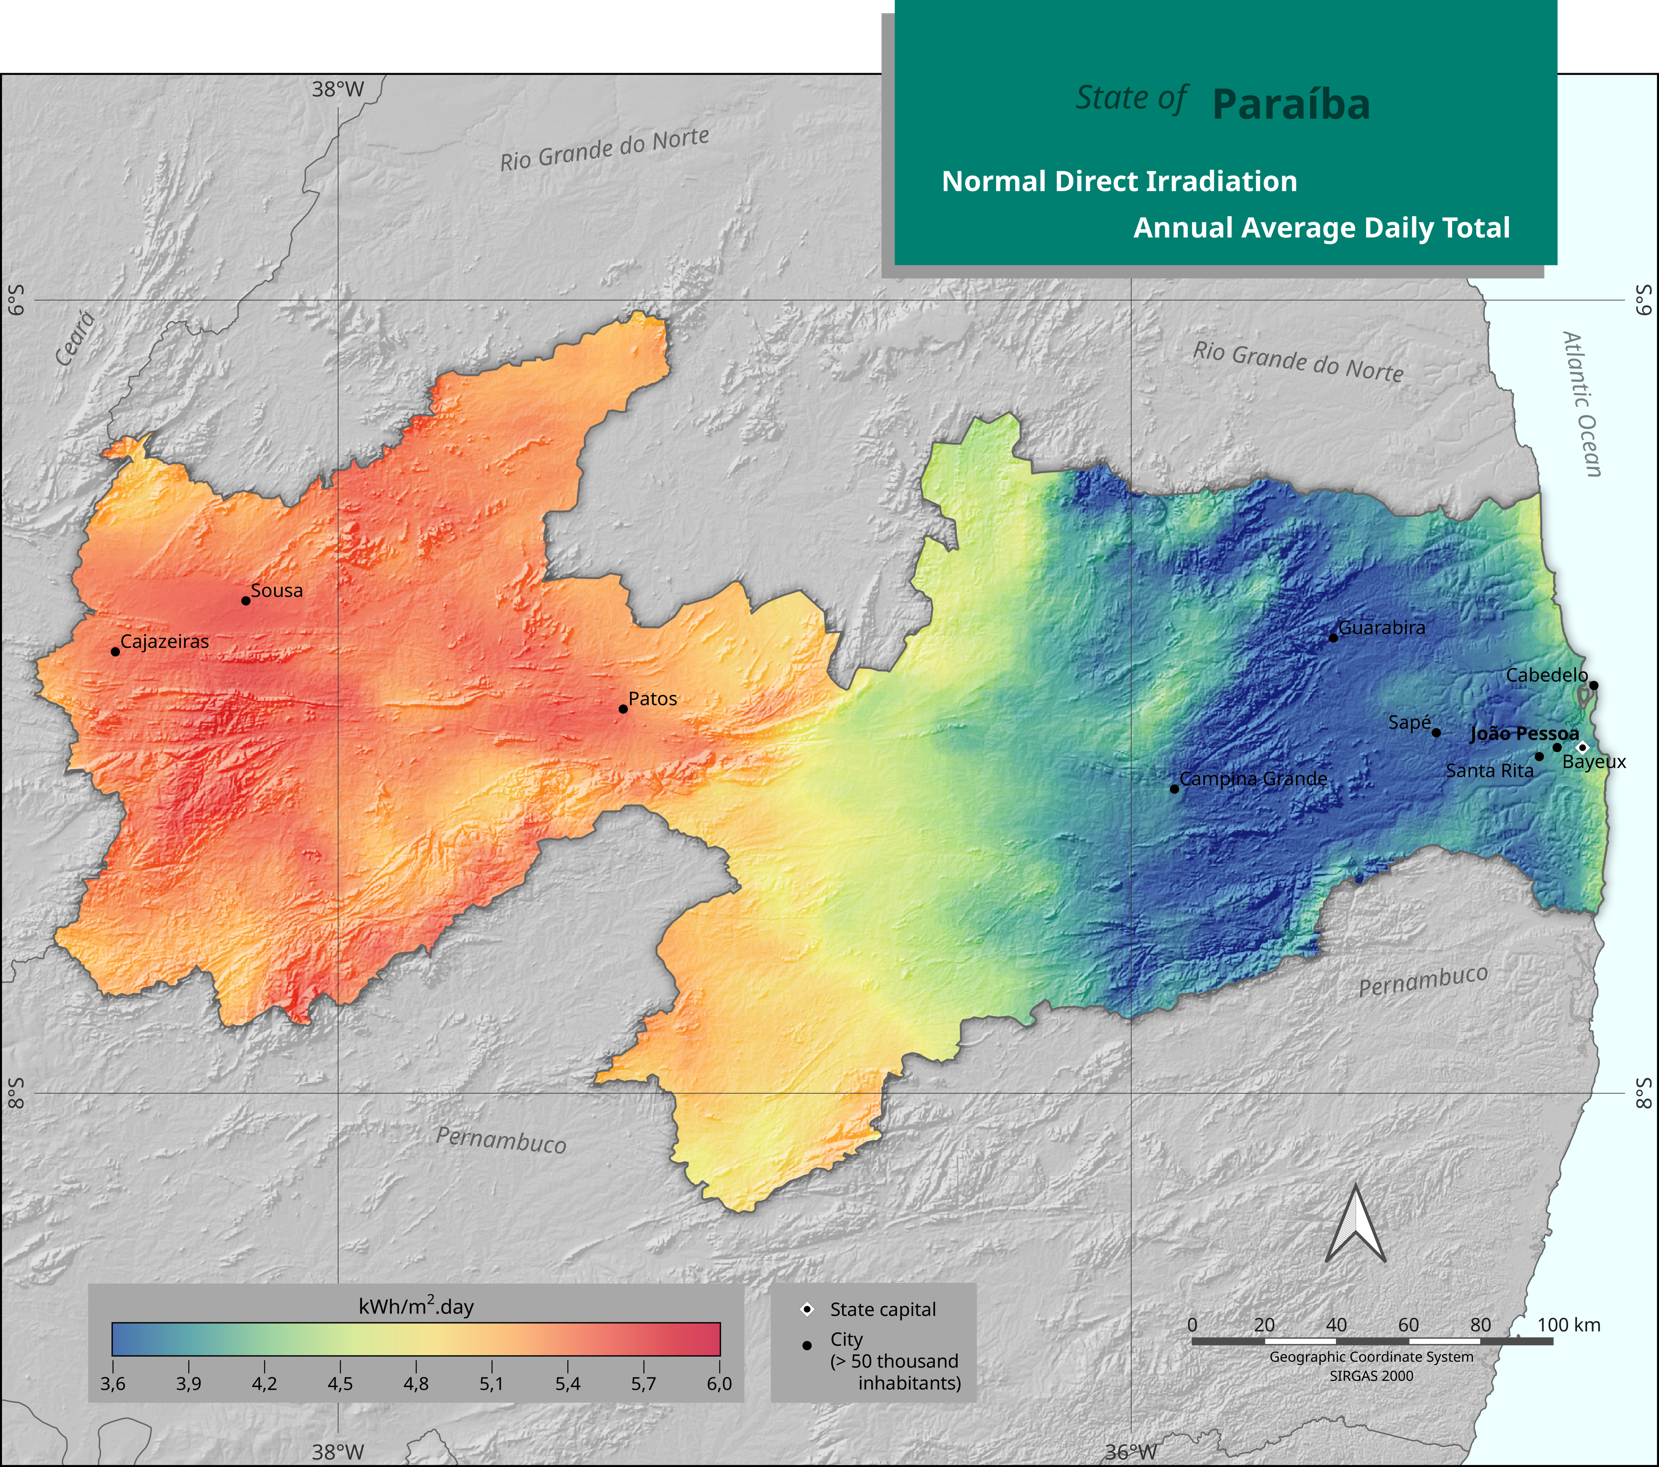
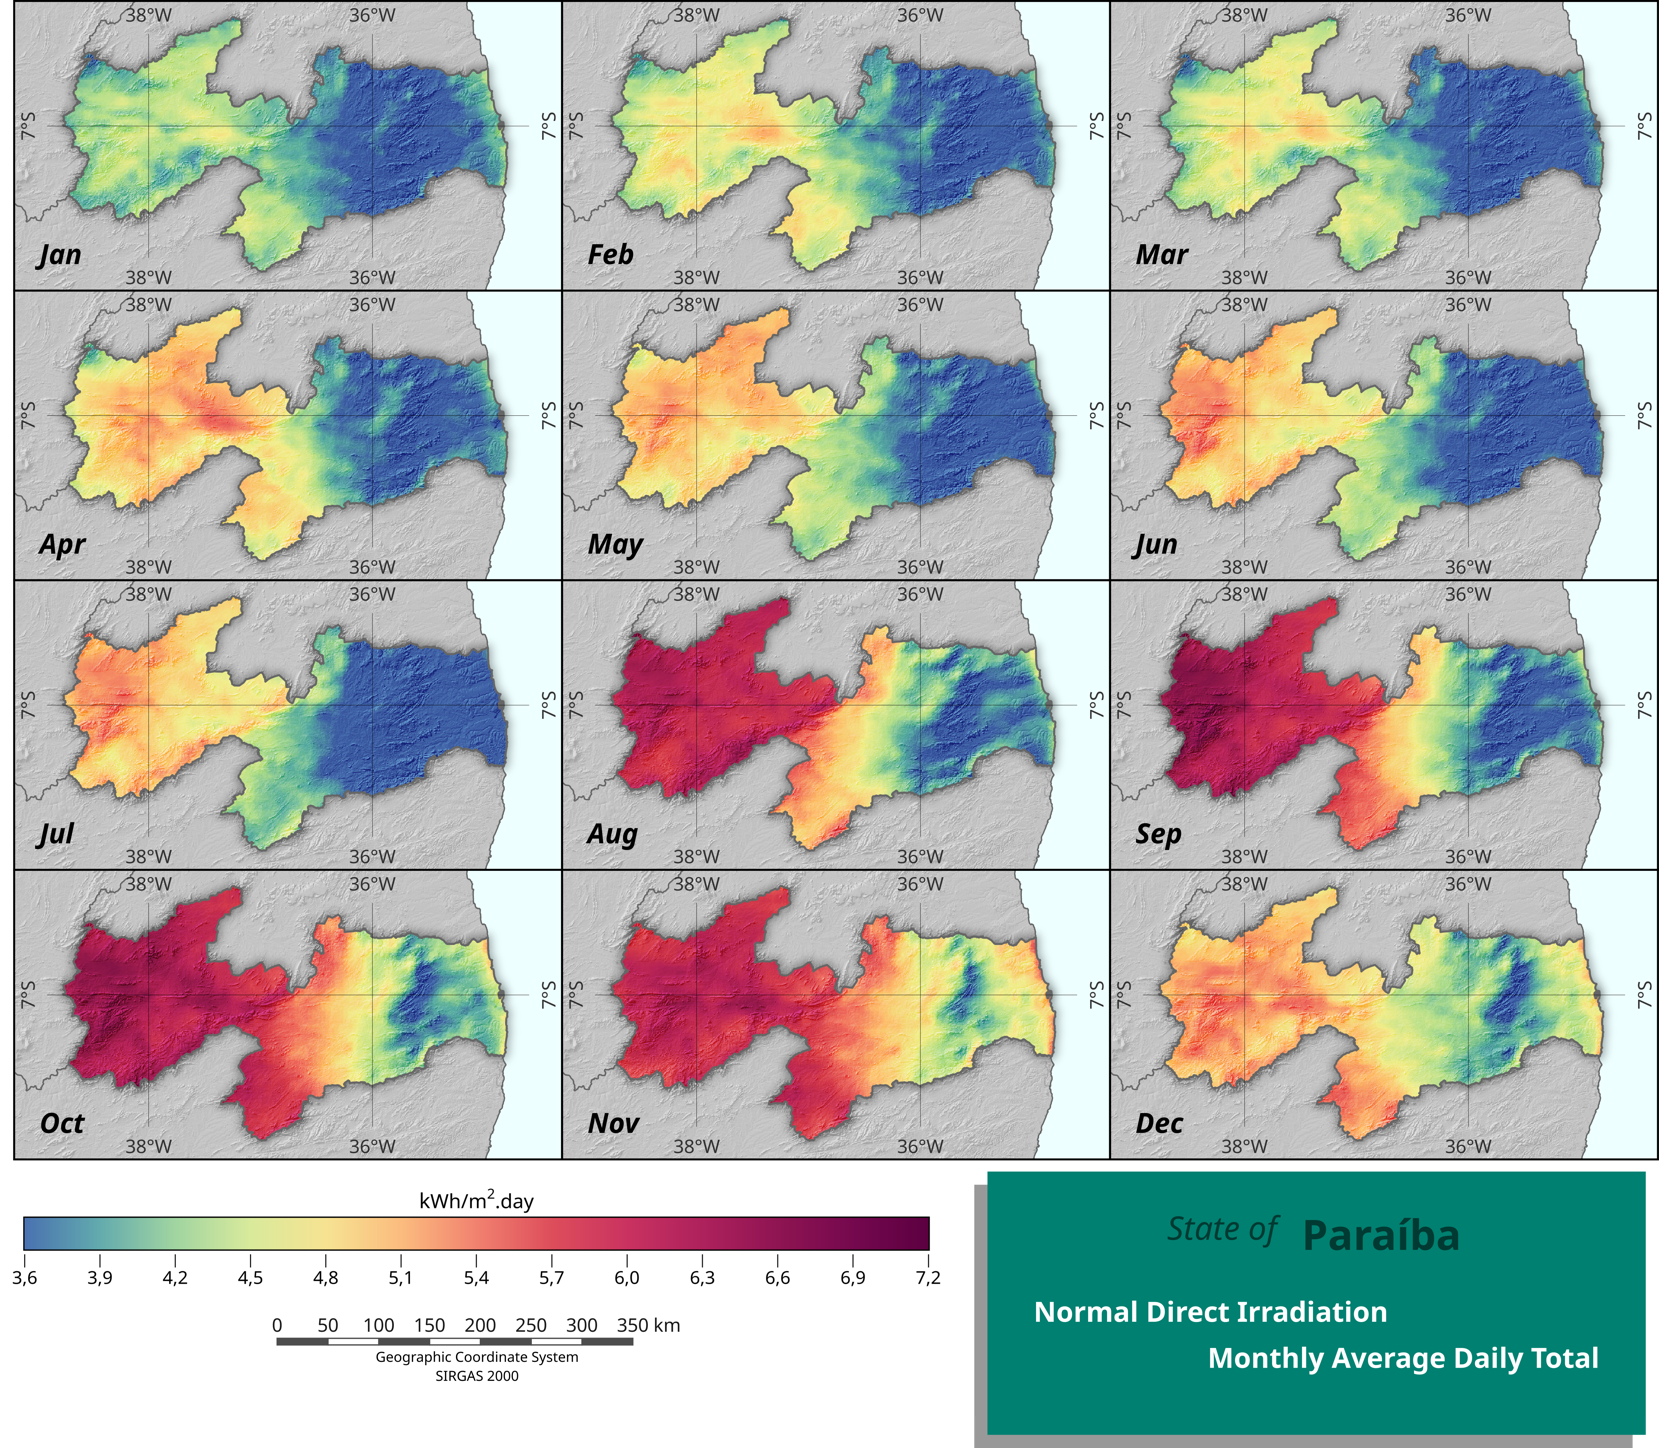
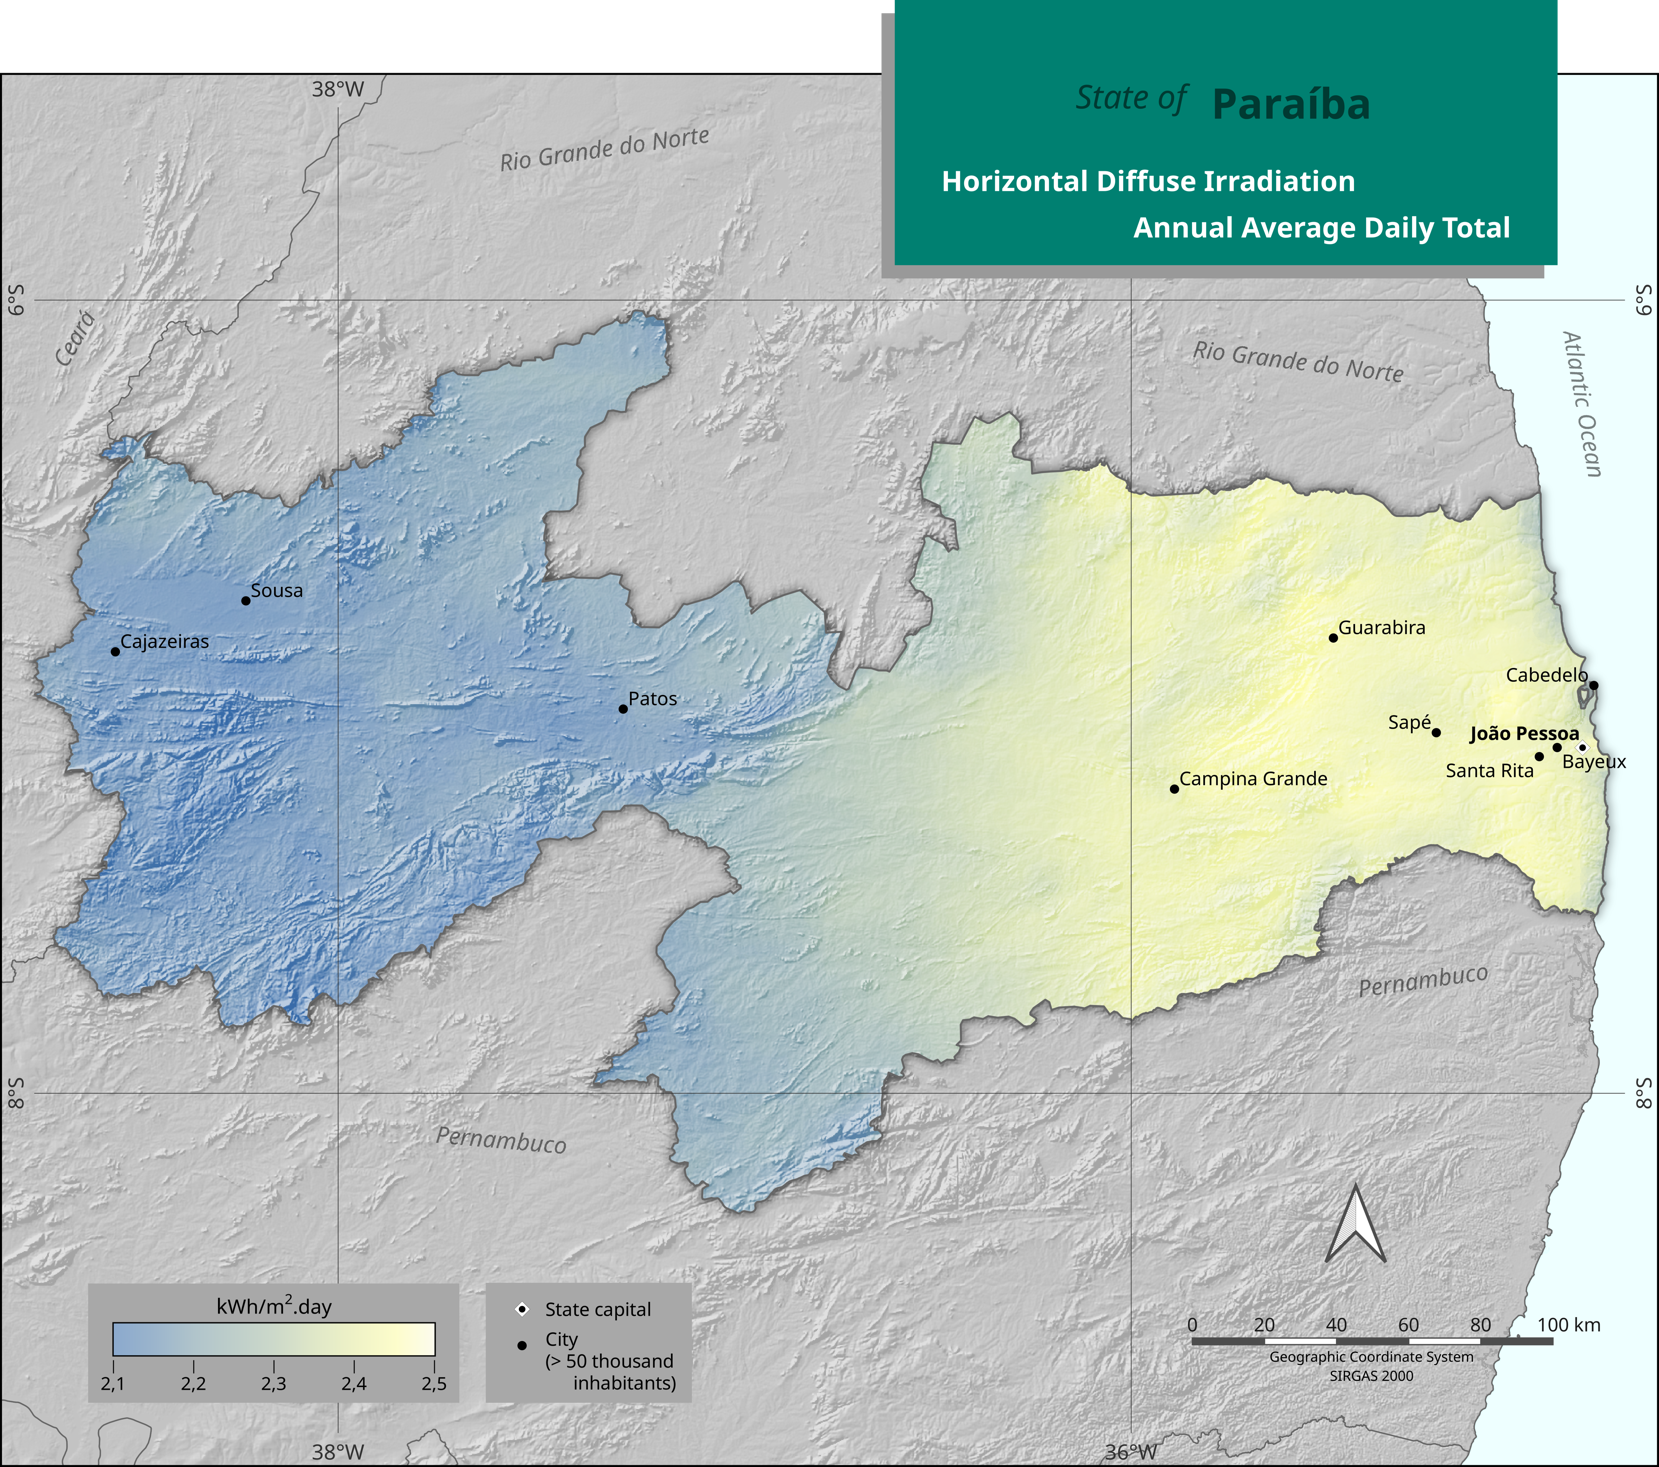
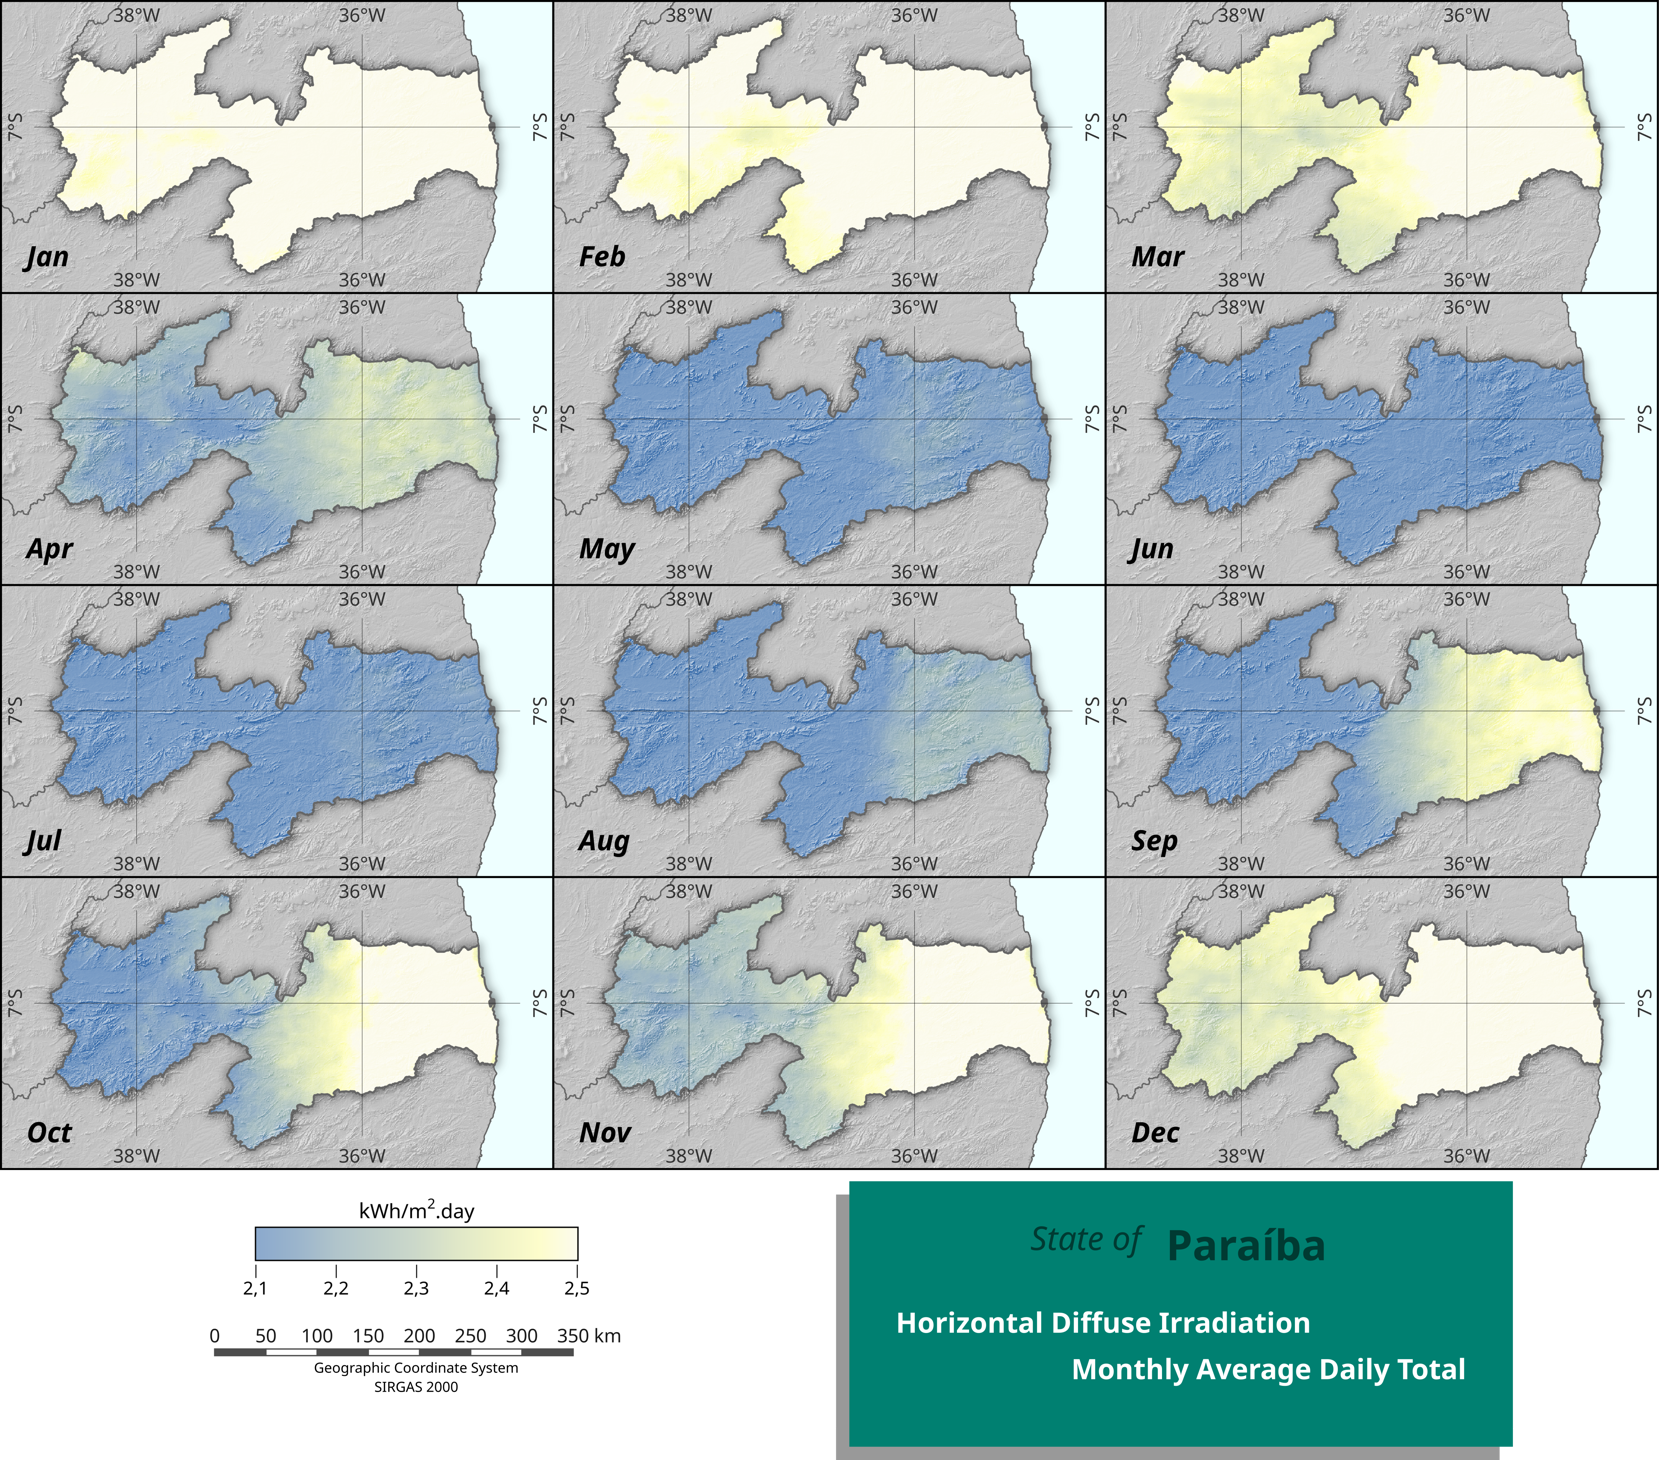
The following pages present the solarimetric maps obtained from simulations of the BRASIL-SR model between January 2012 and December 2021. Each of the surface solar irradiation components is presented by a map of the annual average of the daily totals, followed by twelve maps with monthly average values of the daily totals. The sequence of presentation of the charts follows global irradiation in the horizontal plane (GHI), global irradiation in the inclined plane at 10° relative to the horizontal plane (GTI₁₀), direct irradiation normal to the surface (DNI), and diffuse irradiation in the horizontal plane (DHI).
The maps highlight a higher incidence of solar irradiation in the west of Paraíba, with average values for GHI of up to 6.2 kWh/m² per day. The Brejo Paraibano, located between the Immediate Regions of Campina Grande and Guarabira (see Figure 1.1), had the lowest incidence of solar irradiation (with GHI values of approximately 5 kWh/m².day) but still higher than the average determined in previous studies (Pereira et al., 2017) for GHI solar irradiation in the Brazilian territory (about 4.8 kWh/m².day).
The maps also make it possible to identify the seasonal variability of the solar irradiation incidence in Paraíba. The solar energy resource grows from July, reaching maximum values in November, when the GHI component on the surface reaches values of up to 7 kWh/m² .day. The minimum incidence of solar energy in the territory of Paraíba occurs in June, when the highest GHI values observed in the west of the state are around 5.5 kWh/m². It is important to remember the information presented in the second chapter of this Atlas on the seasonal precipitation cycle in the state - where the rainy season occurs mainly between February and June, depending on the region of the state.
The solarimetric charts were elaborated with a spatial resolution of around 16 km², allowing a spatial detailing of the information about the surface solar irradiation in the region. The solar energy maps are crucial for energy entrepreneurs and stakeholders who need information about the solar energy potential in the Paraíba territory. Access to this information is available on the Web Tool provided by the Secretariat of Infrastructure and Water Resources of the State of Paraíba, where, in addition to checking annual and monthly values of the solar resource, the user can perform basic simulations and find out about the estimated potential for generating electricity using solar energy at points or even in areas of interest. However, it is important to note that the Web Tool should not be used for designing and sizing solar power systems. For this, it is necessary to prepare an executive project carried out by qualified professionals in order to meet the specific technical requirements associated with the characteristics of the installation site (possible shading, lighting geometry, support infrastructure for photovoltaic modules, etc.) and established in regulations published by the energy concessionaire.
Click on the image to enlarge
Click on the image to enlarge
Click on the image to enlarge
Click on the image to enlarge
Click on the image to enlarge
Click on the image to enlarge
Click on the image to enlarge
Click on the image to enlarge